Feat: multiple value axis alignment #13210
Conversation
|
Thanks for your contribution! The pull request is marked to be |
| const extent = axis.scale.getExtent(); | ||
| const interval = (axis.scale as IntervalScale).getInterval(); | ||
| if (((extent[1] - extent[0]) % interval) === 0) { | ||
| extent[1] = extent[1] + (maxSplitNumber - splitNumber[index]) * interval; |
There was a problem hiding this comment.
Should be extent[1] += (maxSplitNumber - splitNumber[index]) * interval here?
Also, I'm wondering if there is a case that all the values are negative. And the extent is [-10, 0]. In this case, developers may prefer extent[0] -= (maxSplitNumber - splitNumber[index]) * interval
|
The result looks good! I've left some of my questions and suggestions. |
|
Hi @pissang I have solved the problem you mentioned, Could you review this please? |
|
Seems the last two cases are broken.
|
@pissang No, those were the line for |

|
Right now, this doesn't work with |
|
It's strange that the top and bottom ticks of two axes don't align. I'd suggest adding more cases to define the expected aligning behavior when different axis options BTW: I found it will throw errors in axes.html |
|
@pissang More test cases added. |
|
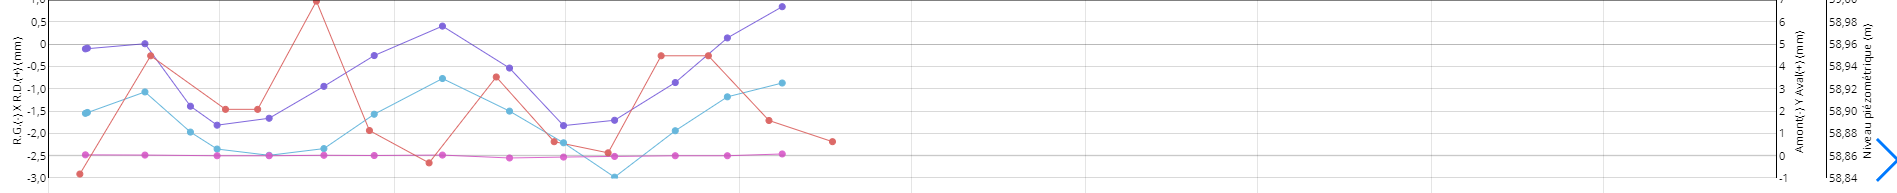
Any updates on this? My clients really need this feature because the charts are really ugly without this.
And this is the result with another charting library:
|

|
@susiwen8 I will take a deep look at this PR and keep the work based on your change these days |
Brief Information
This pull request is in the type of:
What does this PR do?
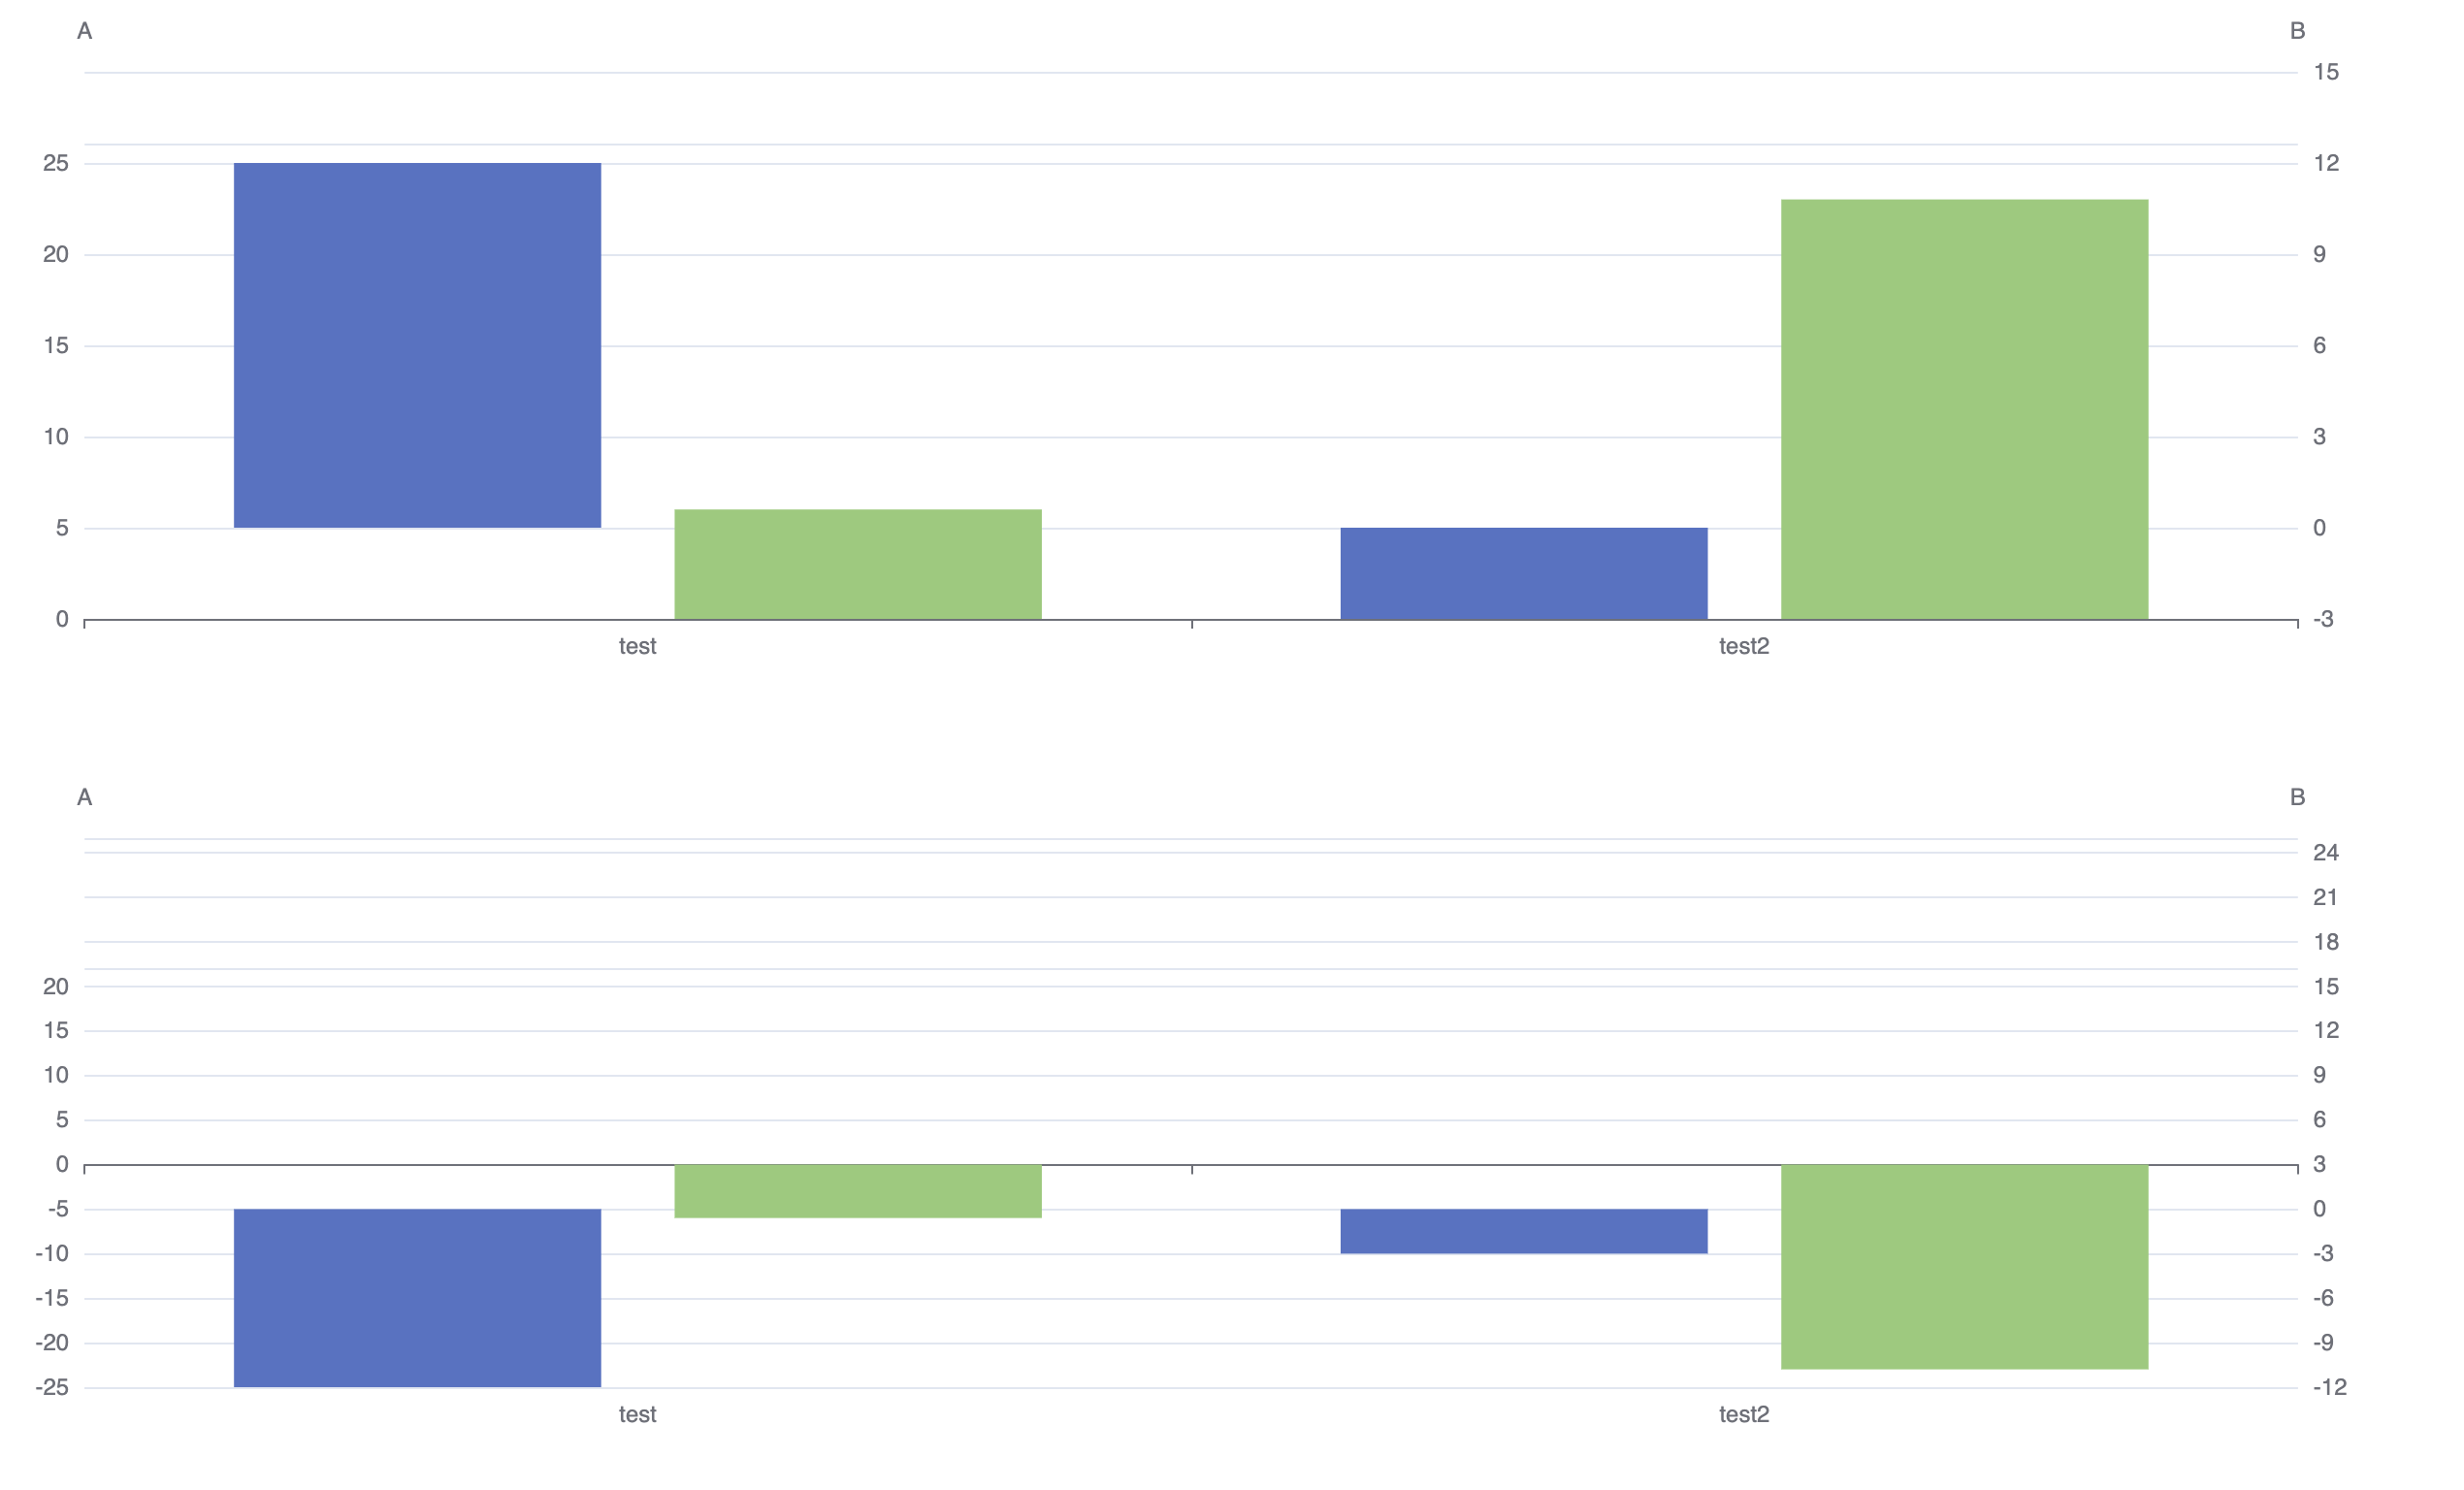
Multiple value axis alignment
Fixed issues
Close #11390
Close #10928
Details
calAxisNiceSplitNumber: this function calculatesnice splitof eachvalueaxis. Because user can specifyminormaxtoaxis,axismight not be cut evenly. It returns an array ofnice split, find out the biggest one, apply to allaxis, ideally, eachaxishas samenice splitnumber (in most case which some option haven't been specified likemin,max,minIntervaletc ).resetAxisExtent: this function usecalAxisNiceSplitNumberresult to setscaleagain, then getaxisfinal split number(finalSplitNumber)adjustValueAxes: this function use biggestfinalSplitNumberto calculateunionExtentwhich represent one unit split's length, then base onaxis scale extentandaxis scale interval, we can get that in this grid eachaxisproportion. multiply byunionExtent, it's finalaxis extentUsage
Are there any API changes?
Related test cases or examples to use the new APIs
NA.
Others
Merging options
TODO
min