Current Behavior
I am using APISIX version 3.2.0.
The data plane of APISIX connects to etcd through gRPC.
At the beginning everything was running well, but after a period of time (around 8 hours), the error log of APISIX continued to showe the following error message:
2023/04/19 10:27:56 [error] 25793#25793: *5597441 [lua] config_etcd.lua:659: failed to fetch data from etcd: /usr/local/apisix/apisix/core/config_util.lua:99: attempt to index local 'item' (a boolean value)
stack traceback:
        /usr/local/apisix/apisix/core/config_util.lua:99: in function 'fire_all_clean_handlers'
        /usr/local/apisix/apisix/core/config_etcd.lua:376: in function 'sync_data'
        /usr/local/apisix/apisix/core/config_etcd.lua:606: in function </usr/local/apisix/apisix/core/config_etcd.lua:596>
        [C]: in function 'xpcall'
        /usr/local/apisix/apisix/core/config_etcd.lua:596: in function </usr/local/apisix/apisix/core/config_etcd.lua:574>,  etcd key: /apisix/upstreams, context: ngx.timer
2023/04/19 10:27:56 [error] 25793#25793: *5597452 [lua] config_etcd.lua:659: failed to fetch data from etcd: /usr/local/apisix/apisix/core/config_util.lua:99: attempt to index local 'item' (a boolean value)
stack traceback:
        /usr/local/apisix/apisix/core/config_util.lua:99: in function 'fire_all_clean_handlers'
        /usr/local/apisix/apisix/core/config_etcd.lua:376: in function 'sync_data'
        /usr/local/apisix/apisix/core/config_etcd.lua:606: in function </usr/local/apisix/apisix/core/config_etcd.lua:596>
        [C]: in function 'xpcall'
        /usr/local/apisix/apisix/core/config_etcd.lua:596: in function </usr/local/apisix/apisix/core/config_etcd.lua:574>,  etcd key: /apisix/routes, context: ngx.timer
2023/04/19 10:27:56 [error] 25788#25788: *5597471 [lua] config_etcd.lua:659: failed to fetch data from etcd: /usr/local/apisix/apisix/core/config_util.lua:99: attempt to index local 'item' (a boolean value)
stack traceback:
        /usr/local/apisix/apisix/core/config_util.lua:99: in function 'fire_all_clean_handlers'
        /usr/local/apisix/apisix/core/config_etcd.lua:376: in function 'sync_data'
        /usr/local/apisix/apisix/core/config_etcd.lua:606: in function </usr/local/apisix/apisix/core/config_etcd.lua:596>
        [C]: in function 'xpcall'
        /usr/local/apisix/apisix/core/config_etcd.lua:596: in function </usr/local/apisix/apisix/core/config_etcd.lua:574>,  etcd key: /apisix/upstreams, context: ngx.timer
After I restarted APISIX, the error message in the log disappeared. Currently, I have encountered this problem twice and each time it was only resolved by restarting APISIX.
Additionally, when APISIX encounters this error, I noticed an increase in traffic to Etcd and it remained at a consistent level. I feel that this is caused by APISIX continuously requesting Etcd.
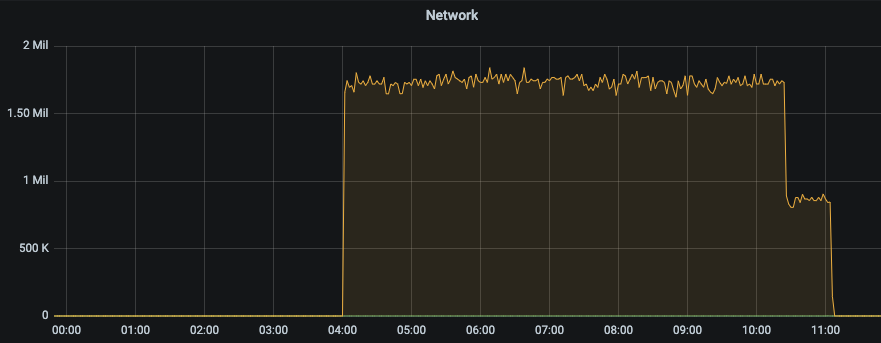
In the picture, the time when Etcd traffic decreased was when I restarted APISIX.
Additionally, there is a potentially important piece of information: I upgraded from version 2.13.3 to version 3.2.0. Currently, I have only upgraded the APISIX data plane and have not yet upgraded the APISIX control plane or Dashboard. I followed the upgrade documentation for this process. Furthermore, I think that this issue may not be closely related to the upgrade of APISIX since it mainly affects communication between APISIX and Etcd.
Expected Behavior
I would like to know what could be the reason for this issue. If needed, I can try to provide more information.
Error Logs
No response
Steps to Reproduce
I don't know how to reproduce this because after APISIX restarts, the problem disappears. It only reappears after a period of time and cannot be consistently reproduced.
Environment
- APISIX version (run
apisix version): 3.2.0
- Operating system (run
uname -a): Linux knode10-72-73-177 5.15.29-200.el7.x86_64 #1 SMP Thu Mar 31 14:09:17 UTC 2022 x86_64 x86_64 x86_64 GNU/Linux
- OpenResty / Nginx version (run
openresty -V or nginx -V):
nginx version: openresty/1.21.4.1
built by gcc 9.3.1 20200408 (Red Hat 9.3.1-2) (GCC)
built with OpenSSL 1.1.1s  1 Nov 2022 (running with OpenSSL 1.1.1n  15 Mar 2022)
TLS SNI support enabled
configure arguments: --prefix=/usr/local/openresty/nginx --with-cc-opt='-O2 -DAPISIX_BASE_VER=1.21.4.1.7 -DNGX_GRPC_CLI_ENGINE_PATH=/usr/local/openresty/libgrpc_engine.so -DNGX_HTTP_GRPC_CLI_ENGINE_PATH=/usr/local/openresty/libgrpc_engine.so -DNGX_LUA_ABORT_AT_PANIC -I/usr/local/openresty/zlib/include -I/usr/local/openresty/pcre/include -I/usr/local/openresty/openssl111/include' --add-module=../ngx_devel_kit-0.3.1 --add-module=../echo-nginx-module-0.62 --add-module=../xss-nginx-module-0.06 --add-module=../ngx_coolkit-0.2 --add-module=../set-misc-nginx-module-0.33 --add-module=../form-input-nginx-module-0.12 --add-module=../encrypted-session-nginx-module-0.09 --add-module=../srcache-nginx-module-0.32 --add-module=../ngx_lua-0.10.21 --add-module=../ngx_lua_upstream-0.07 --add-module=../headers-more-nginx-module-0.33 --add-module=../array-var-nginx-module-0.05 --add-module=../memc-nginx-module-0.19 --add-module=../redis2-nginx-module-0.15 --add-module=../redis-nginx-module-0.3.9 --add-module=../ngx_stream_lua-0.0.11 --with-ld-opt='-Wl,-rpath,/usr/local/openresty/luajit/lib -Wl,-rpath,/usr/local/openresty/wasmtime-c-api/lib -L/usr/local/openresty/zlib/lib -L/usr/local/openresty/pcre/lib -L/usr/local/openresty/openssl111/lib -Wl,-rpath,/usr/local/openresty/zlib/lib:/usr/local/openresty/pcre/lib:/usr/local/openresty/openssl111/lib' --add-module=/tmp/tmp.xYfSxgSEeh/openresty-1.21.4.1/../mod_dubbo-1.0.2 --add-module=/tmp/tmp.xYfSxgSEeh/openresty-1.21.4.1/../ngx_multi_upstream_module-1.1.1 --add-module=/tmp/tmp.xYfSxgSEeh/openresty-1.21.4.1/../apisix-nginx-module-1.12.0 --add-module=/tmp/tmp.xYfSxgSEeh/openresty-1.21.4.1/../apisix-nginx-module-1.12.0/src/stream --add-module=/tmp/tmp.xYfSxgSEeh/openresty-1.21.4.1/../apisix-nginx-module-1.12.0/src/meta --add-module=/tmp/tmp.xYfSxgSEeh/openresty-1.21.4.1/../wasm-nginx-module-0.6.4 --add-module=/tmp/tmp.xYfSxgSEeh/openresty-1.21.4.1/../lua-var-nginx-module-v0.5.3 --add-module=/tmp/tmp.xYfSxgSEeh/openresty-1.21.4.1/../grpc-client-nginx-module-v0.4.2 --with-poll_module --with-pcre-jit --with-stream --with-stream_ssl_module --with-stream_ssl_preread_module --with-http_v2_module --without-mail_pop3_module --without-mail_imap_module --without-mail_smtp_module --with-http_stub_status_module --with-http_realip_module --with-http_addition_module --with-http_auth_request_module --with-http_secure_link_module --with-http_random_index_module --with-http_gzip_static_module --with-http_sub_module --with-http_dav_module --with-http_flv_module --with-http_mp4_module --with-http_gunzip_module --with-threads --with-compat --with-stream --with-http_ssl_module
- etcd version, if relevant (run
curl http://127.0.0.1:9090/v1/server_info): 3.5.4
- APISIX Dashboard version, if relevant:
- Plugin runner version, for issues related to plugin runners:
- LuaRocks version, for installation issues (run
luarocks --version):

Current Behavior
I am using APISIX version 3.2.0.
The data plane of APISIX connects to etcd through gRPC.
At the beginning everything was running well, but after a period of time (around 8 hours), the error log of APISIX continued to showe the following error message:
After I restarted APISIX, the error message in the log disappeared. Currently, I have encountered this problem twice and each time it was only resolved by restarting APISIX.
Additionally, when APISIX encounters this error, I noticed an increase in traffic to Etcd and it remained at a consistent level. I feel that this is caused by APISIX continuously requesting Etcd.
Additionally, there is a potentially important piece of information: I upgraded from version 2.13.3 to version 3.2.0. Currently, I have only upgraded the APISIX data plane and have not yet upgraded the APISIX control plane or Dashboard. I followed the upgrade documentation for this process. Furthermore, I think that this issue may not be closely related to the upgrade of APISIX since it mainly affects communication between APISIX and Etcd.
Expected Behavior
I would like to know what could be the reason for this issue. If needed, I can try to provide more information.
Error Logs
No response
Steps to Reproduce
I don't know how to reproduce this because after APISIX restarts, the problem disappears. It only reappears after a period of time and cannot be consistently reproduced.
Environment
apisix version):3.2.0uname -a):Linux knode10-72-73-177 5.15.29-200.el7.x86_64 #1 SMP Thu Mar 31 14:09:17 UTC 2022 x86_64 x86_64 x86_64 GNU/Linuxopenresty -Vornginx -V):curl http://127.0.0.1:9090/v1/server_info):3.5.4luarocks --version):