
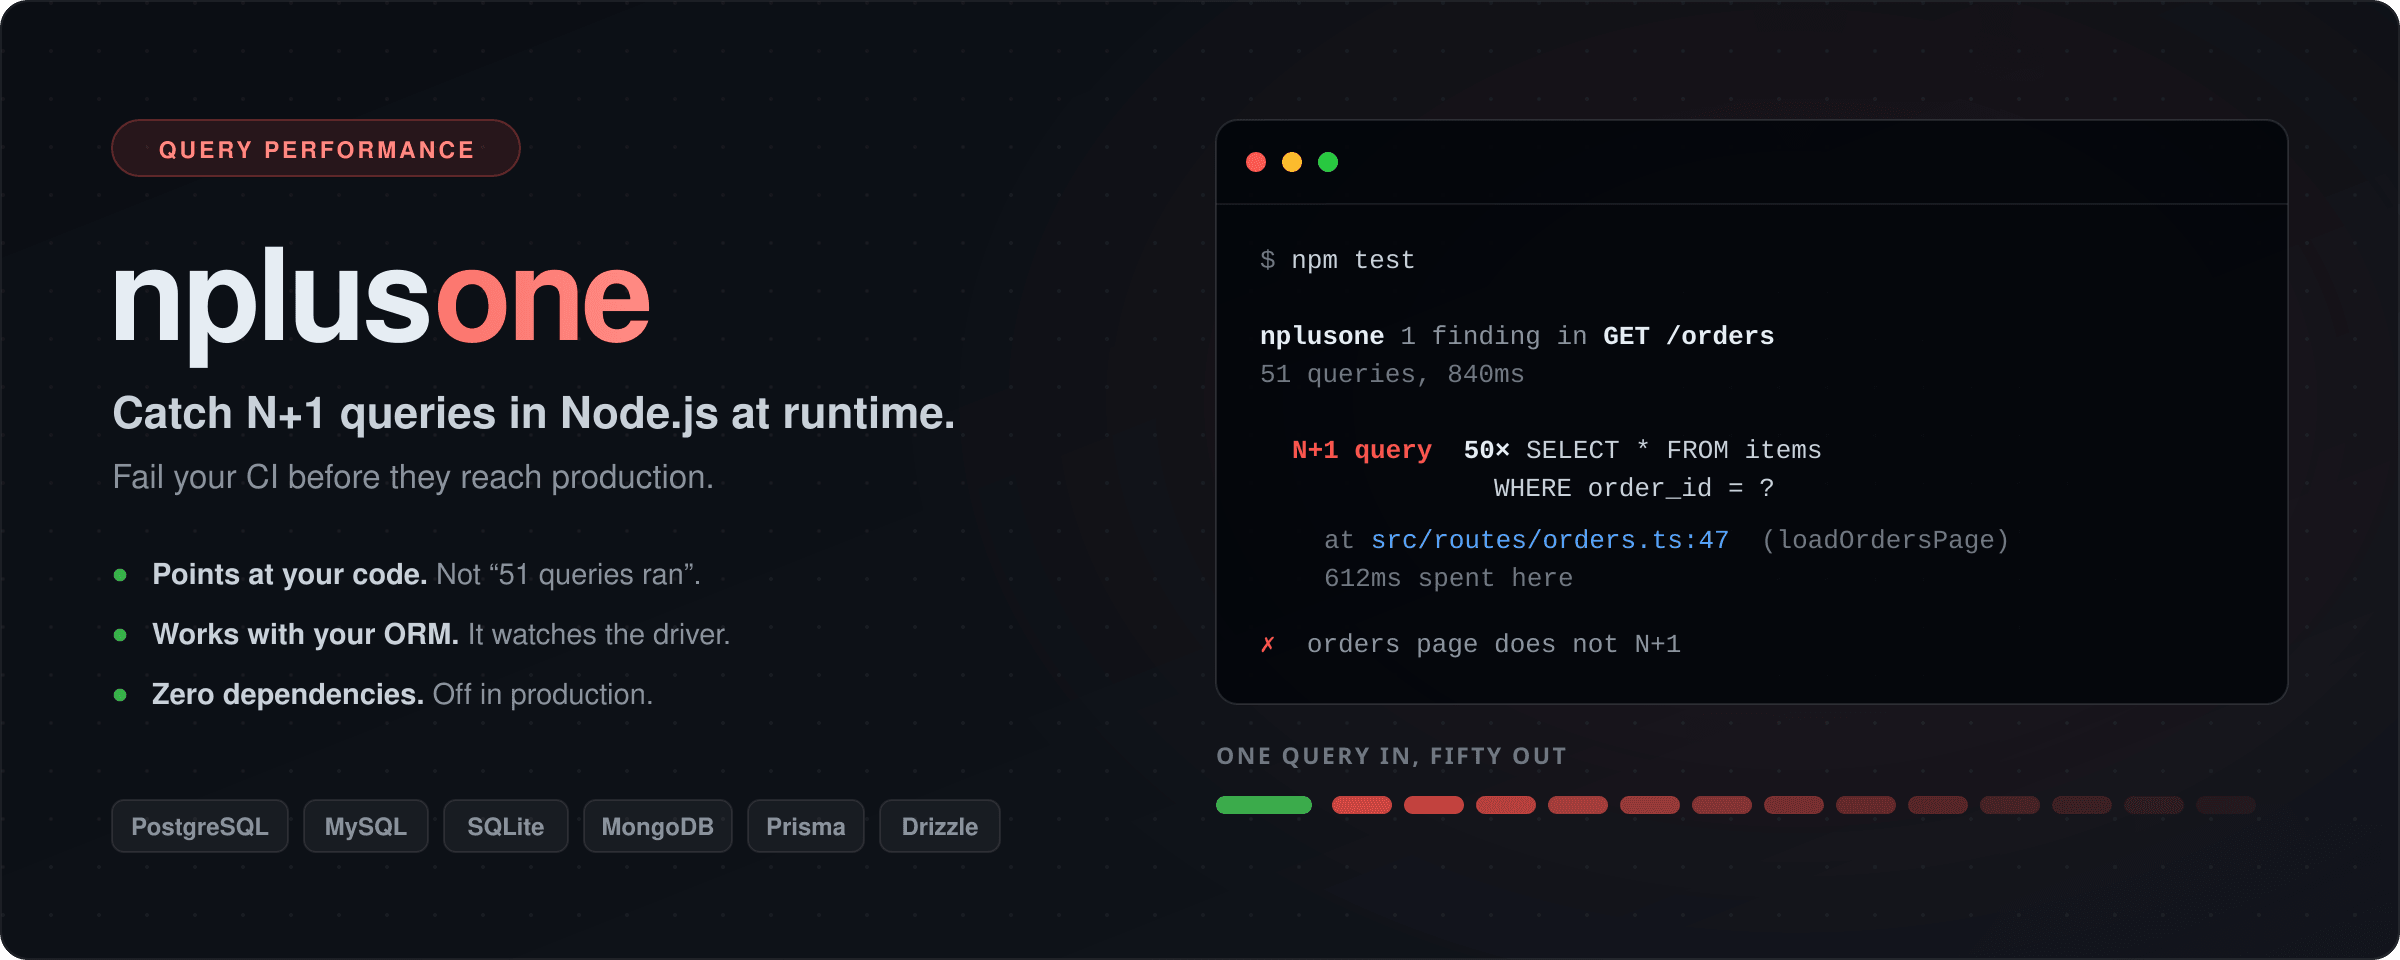


Ruby has bullet. Python has nplusone.
Node has had to make do with squinting at query logs. This is that tool.
nplusone 2 findings in GET /orders — 10 queries, 14ms

  N+1 query  7× SELECT * FROM order_items WHERE order_id = ?
     at src/routes/orders.ts:47:38  (loadOrdersPage)
     9.3ms spent here

  Duplicate query  2× SELECT * FROM settings WHERE user_id = ?
     at src/lib/settings.ts:32:29  (loadSettings)
     2.4ms spent here
     identical parameters — the repeats returned the same rows
| 🔌 | Works with your ORM, whatever it is. It watches the database driver, not the abstraction on top. |
| 📍 | Points at your code. Not "51 queries ran" — this line ran 50 of them. |
| 🧪 | CI gate. expectNoNPlusOne() turns a debugging session into a regression test. |
| 🪶 | Zero runtime dependencies. 68 kB packed. |
| 🔒 | Off in production by default, so nobody pays for stack capture by accident. |
const orders = await db.query("SELECT * FROM orders WHERE user_id = $1", [userId]);

for (const order of orders) {
  order.items = await db.query("SELECT * FROM items WHERE order_id = $1", [order.id]);
}
Fifty orders, fifty-one queries.
It is invisible in development against a seeded database with three rows, and it is the single most common reason a page that felt instant in review takes four seconds in production.
npm install --save-dev nplusoneTested on Node 18, 20, 22 and 24, and on Deno and Bun — see Runtimes for what each one does with attribution.
The package is ESM. import works on every version above; require() works
from Node 20.19 onwards, which is where Node backported requiring an ES module.
On Node 18 — end-of-life since April 2025 — use import.
Two lines at boot, one middleware:
import pg from "pg";
import { configure } from "nplusone";
import { instrumentPg } from "nplusone/pg";
import { nplusoneMiddleware } from "nplusone/http";

configure({ threshold: 5 });
instrumentPg(pg);

app.use(nplusoneMiddleware());
That is it. Hit a page, and anything suspicious prints to stderr with the line that caused it.
Because the detector hooks the driver, every query builder and ORM on top of that driver is covered without needing its own adapter.
| Your stack | Setup | |
|---|---|---|
PostgreSQL (pg) |
instrumentPg(pg) |
✅ |
PostgreSQL (postgres.js) |
instrumentPostgresJs(sql) |
✅ |
MySQL / MariaDB (mysql2) |
instrumentMysql2(mysql) |
✅ |
SQL Server (mssql) |
instrumentMssql(mssql) |
✅ |
Oracle (oracledb) |
instrumentOracle(oracledb) |
✅ |
SQLite (better-sqlite3) |
instrumentBetterSqlite3(Database) |
✅ |
SQLite (node:sqlite) |
instrumentNodeSqlite(sqlite) |
✅ |
libSQL / Turso (@libsql/client) |
instrumentLibsql(client) |
✅ |
| MongoDB | instrumentMongodb(mongodb) |
✅ |
Redis (ioredis) |
instrumentIoredis(Redis) |
✅ |
| OpenSearch / Elasticsearch | instrumentOpenSearch(client) |
✅ |
| Prisma | instrumentPrisma(client) |
✅ |
| Drizzle | driver + instrumentDrizzle(db) |
✅ |
| Knex | via its driver | ✅ |
| TypeORM | via its driver | ✅ |
| MikroORM | via its driver (Knex) | ✅ |
| Sequelize | via its driver | ✅ |
| Kysely | via its driver — no adapter needed | ✅ |
| Mongoose | via the MongoDB driver | ✅ |
| Anything else | 10 lines with record() |
🔧 |
Two exceptions worth knowing about.
Prisma does not use
pgormysql2at all — it talks to the database through its own query engine, so driver-level instrumentation cannot see it. Hence a dedicated adapter.Drizzle is detected through its driver, but without attribution. A Drizzle query is a lazy thenable, so the execution is triggered by the runtime calling
.then()— measured against Drizzle 0.45, the stack at that point holds twelve frames and not one of them belongs to your code. AddinginstrumentDrizzle(db)captures the call site while the query is still being built, and the driver adapter uses it. Use both together: the driver reports the SQL, Drizzle reports the line.
Kysely looks like it should have the same problem as Drizzle, and it does not. Measured against Kysely 0.29 on a synchronous driver (node:sqlite) and an asynchronous one (pg), the reported line was correct in every shape tried — an inline loop, a helper-built query, executeTakeFirst, a raw sql template tag, and inside a transaction. Including the helper-built case that Drizzle gets wrong:
function baseQuery() {
  return db.selectFrom("items").selectAll();
}
for (const order of orders) {
  await baseQuery().where("order_id", "=", order.id).execute();   // <- correctly blamed
}
The reason is structural rather than lucky. A Kysely builder is not a thenable: nothing runs until you call .execute() yourself, and V8's async stack traces keep the frame that awaited it. Drizzle's .then() is called by the runtime from a microtask, so there is no such frame to keep.
That is a claim about a library this one does not control, so test/kysely.test.ts pins it: if a future Kysely defers execution differently, the suite fails rather than the README quietly becoming wrong.
Setup for each driver
PostgreSQL — covers Drizzle, Knex, TypeORM, MikroORM, Sequelize, Kysely, raw SQL:
import pg from "pg";
import { instrumentPg } from "nplusone/pg";

instrumentPg(pg);
MySQL / MariaDB — also covers mysql2/promise:
import mysql from "mysql2";
import { instrumentMysql2 } from "nplusone/mysql2";

instrumentMysql2(mysql);
SQL Server — covers query(), batch(), stored procedures and prepared statements:
import mssql from "mssql";
import { instrumentMssql } from "nplusone/mssql";

instrumentMssql(mssql);
Oracle — execute, executeMany and queryStream, pooled or not:
import oracledb from "oracledb";
import { instrumentOracle } from "nplusone/oracledb";

instrumentOracle(oracledb);
Redis — a loop of GETs is the same bug as a loop of SELECTs:
import Redis from "ioredis";
import { instrumentIoredis } from "nplusone/ioredis";

instrumentIoredis(Redis);
OpenSearch / Elasticsearch — patches the transport, so every API method is covered:
import { Client } from "@opensearch-project/opensearch";
import { instrumentOpenSearch } from "nplusone/opensearch";

const client = new Client({ node: process.env.OPENSEARCH_URL });
instrumentOpenSearch(client);SQLite:
import Database from "better-sqlite3";
import { instrumentBetterSqlite3 } from "nplusone/sqlite";

instrumentBetterSqlite3(Database);
import * as sqlite from "node:sqlite";
import { instrumentNodeSqlite } from "nplusone/sqlite";
instrumentNodeSqlite(sqlite);libSQL / Turso:
import { createClient } from "@libsql/client";
import { instrumentLibsql } from "nplusone/libsql";

const client = createClient({ url: process.env.TURSO_DATABASE_URL! });
instrumentLibsql(client);
Drizzle — pair it with the driver adapter. Returns a new db, so use the returned one:
import { drizzle } from "drizzle-orm/postgres-js";
import { instrumentDrizzle } from "nplusone/drizzle";

instrumentPostgresJs(sql);                                  // reports the SQL
export const db = instrumentDrizzle(drizzle(sql, { schema })); // reports the line
Construction and execution are not always the same place. When a repository helper builds the query and a route runs it in a loop, the loop is what you need to see — so the adapter keeps both origins and reports the one nearest to execution:
  N+1 query  10× SELECT * FROM order_items WHERE order_id = ?
     at src/routes/orders.ts:38  (loadOrders)
     built at src/repositories/items.ts:12  (baseQuery)
The built at line only appears when it says something the first line does not.
postgres.js — returns a new sql, since it is a function rather than an object. Use the returned one:
import postgres from "postgres";
import { instrumentPostgresJs } from "nplusone/postgresjs";

export const sql = instrumentPostgresJs(postgres(process.env.DATABASE_URL));
MongoDB — also covers Mongoose, which uses this driver underneath:
import * as mongodb from "mongodb";
import { instrumentMongodb } from "nplusone/mongodb";

instrumentMongodb(mongodb);
Prisma — note that this returns a new client, because Prisma clients are immutable. Use the returned one:
import { PrismaClient } from "@prisma/client";
import { instrumentPrisma } from "nplusone/prisma";

export const prisma = instrumentPrisma(new PrismaClient());A scope is the window in which repetition is suspicious — one request, one job, one test. Running the same statement a thousand times a day is normal; running it fifty times while serving one page is not.
Express / Connect / NestJS:
import { nplusoneMiddleware } from "nplusone/http";

app.use(nplusoneMiddleware());
Hono, Next.js route handlers, Bun, Deno, Cloudflare Workers:
import { withRequestScope } from "nplusone/http";

export const GET = withRequestScope(async (request) => {
  return Response.json(await loadOrders());
});
Background jobs, scripts, anything else:
import { runInScope } from "nplusone";

await runInScope("nightly-report", () => generateReport());
Just trying it out? autoScope groups queries that arrive with no scope,
closing the group after a short idle gap — so you see something on the first run
without wiring anything:
configure({ autoScope: true });It is a heuristic, and off by default for that reason: concurrent requests can land in the same inferred group and inflate the counts. The report says so whenever a scope was inferred. For numbers you can trust, and for CI, open a real scope.
This is the part that keeps the bug from coming back.
import { expectNoNPlusOne, expectQueryCount } from "nplusone/test";

test("orders page does not N+1", async () => {
  await expectNoNPlusOne(() => loadOrdersPage(userId));
});

test("dashboard stays within its query budget", async () => {
  await expectQueryCount(() => renderDashboard(userId), 4);
});
A failure names the line:
Expected no N+1 queries in orders page, found 1:

  N+1 query  50× SELECT * FROM items WHERE order_id = ?
     at src/pages/orders.ts:47:38  (loadOrdersPage)
The helpers work whether or not the detector is enabled globally, and restore your configuration afterwards. They throw a plain Error, so Jest, Vitest and node:test all report them correctly with no plugin.
expectNoNPlusOne() is all-or-nothing, which is right for a greenfield project and useless if you already have forty of them: the gate cannot be turned on at all, and a gate you cannot turn on protects nothing.
A baseline freezes what exists today. Known findings pass, new ones fail:
await expectNoNPlusOne(() => renderOrdersPage(userId), {
  baseline: ".nplusone-baseline.json",
});
Write it by running the suite once with the file missing:
NPLUSONE_UPDATE_BASELINE=1 npm testThere is no npx nplusone baseline command, deliberately: findings only exist while your suite runs, so a CLI would have to re-run the suite and guess at how. This is the same shape as a snapshot update, which is a thing your team already knows.
What identifies a finding across runs is the interesting decision, and it is normalized SQL + file + enclosing function name — not the line. Keying on file:line means every entry goes stale the moment somebody adds an import at the top of the file; keying on the SQL alone is too coarse to tell two loops apart. The function name survives a line shift and is already captured. The cost, stated plainly: two anonymous loops in one file issuing the same statement collapse into one entry. Name the function to separate them.
The repetition count is recorded but never enforced. How far a loop runs depends on how much data the test set up, so failing on an increase would make the gate flaky — and a flaky gate gets switched off, which is the failure this feature exists to prevent. The count is there so the diff shows when debt grows.
Entries that nothing matched are reported at exit, so a baseline whose N+1s were long since fixed does not rot in silence. That report is a warning and never a failure. In a runner that shards across worker processes it means "not matched in this process", so check it from a single-process run; NPLUSONE_BASELINE_STALE=off silences it.
Update mode merges and never removes, for the same sharding reason — a worker that rewrote the file from what it saw would delete every other worker's entries. To prune, delete the file and regenerate.
An N+1 counts round trips. A pipeline, an executeMany, an _msearch — these are the fix, and reporting them as the bug would argue against the exact thing you want people to write:
const pipeline = redis.pipeline();
for (const id of ids) pipeline.get(`product:${id}`);
await pipeline.exec();          // one round trip — not a finding
Every statement in one batch shares a discriminator, so fifty of them count as one repetition. A loop of batches still counts as a loop, which is the case genuinely worth catching. The statements are all still recorded and still count towards maxQueries — "this scope does too much work" is a budget question, and the budget is where it belongs.
Inside a scope, two different problems get reported — and keeping them apart is the whole trick:
| Finding | What it means | How you fix it |
|---|---|---|
| N+1 query | One statement shape ran from one line with ≥ threshold different values |
Batch it — WHERE id = ANY($1), a join, or a DataLoader |
| Duplicate query | A byte-identical statement with identical parameters ran ≥ duplicateThreshold times |
Cache it, or hoist it out of the loop |
| Query budget | The scope issued more than maxQueries statements, whatever they were |
Look at the breakdown — usually a layer fetching more than the page needs |
Counting raw repetitions would flag a query that runs ten times with the same argument as an N+1. It isn't one — that's a caching problem with a different fix. So the N+1 rule counts distinct parameter sets, and when a driver interpolates values straight into the SQL, the statement text itself acts as the discriminator.
Statements are normalized before comparison, so WHERE id = 42 and WHERE id = 43 are one shape. The normalizer is a scanner rather than a pile of regexes, because literals need context: -- inside a string is not a comment, the 2 in col2 is not a number, and ::text is a cast rather than a placeholder.
Not every expensive endpoint has an N+1 in it. Running the detector against a real admin API turned up a route that issued fourteen different statements to load one record — nothing repeated, so nothing was reported. maxQueries covers that case:
configure({ maxQueries: 10 });nplusone 1 finding in GET /dashboard — 8 queries, 9ms
Query budget 8 queries in one scope (limit 6)
7.2ms spent querying
1× SELECT count(*) FROM orders
1× SELECT count(*) FROM order_items
1× SELECT * FROM orders ORDER BY created_at DESC LIMIT ?
…
It prints no call site, because there isn't one to print — the total is the finding, not any single line. The breakdown is there instead, ordered by count, so you can see where the budget went.
It is off by default and it never throws, whatever mode says: the check runs when the scope closes, which for a request means a finally block or a finish handler, and throwing from there would replace a real error or take the process down. To fail a test on a budget, use expectQueryCount().
A finding names the shape, the count and the line. sampleValues adds the values, which is how you tell a loop over ten rows from a loop over ten thousand, and how you reproduce it in a console:
configure({ sampleValues: 5 }); N+1 query 50× SELECT * FROM order_items WHERE order_id = ?
at src/routes/orders.ts:38 (loadOrders)
values: [1], [2], [3], [4], [5] … and 45 more
Off by default, and this one is not about noise. Parameters are exactly where email addresses, tokens and personal data live, and this report goes to stderr and from there into CI logs. Everything else the reporter prints is either your own source location or SQL whose literals are already replaced by ?. This is the only option that puts real data in the output, so turning it on should be your decision rather than an upgrade's.
Values are truncated, and never shown for a duplicate finding — its parameters are identical by definition, so a sample of them says nothing.
The line that repeats is only half the fix. The other half is the query that produced the rows being looped over, and the report guesses at it:
  N+1 query  50× SELECT * FROM order_items WHERE order_id = ?
     at src/routes/orders.ts:38  (loadOrders)
     after 1× SELECT * FROM orders WHERE user_id = ?
           at src/routes/orders.ts:34  (loadOrders)
     a guess — the one read just before the loop. Join these, or fetch
     the children in one query, if they are in fact related.
It is a guess and it says so. A candidate is accepted only when it is the statement immediately before the loop's first query, it is a select, and it ran exactly once in the whole scope. Anything less and nothing is printed — a missing line costs you nothing, a wrong one sends you off to join two unrelated tables. The evidence that would settle it, whether the child's parameter came out of the parent's rows, is not available: this library never sees result rows.
So it stays quiet when the ids came from a request body, a cache or another service, and when what precedes the loop is another loop. Turn it off with detectParent: false.
The report arrives when the scope closes. For a request that is soon enough. For a ten-minute background job it arrives at minute ten, and for a worker that never closes its scope it never arrives at all:
configure({ reportWhen: "immediately" }); // or "both", or "scope-close" (default)nplusone live in worker:reindex
N+1 query ≥5× SELECT * FROM items WHERE order_id = ?
at src/jobs/reindex.ts:22 (reindexOrders)
still counting — the total is reported when the scope closes
It cannot tell you the count and does not pretend to. A finding is born when the threshold is crossed — at 5 repetitions of a loop that may run 50 times — so the number is a lower bound and is printed as one. "immediately" prints each finding once, at detection, and holds it out of the scope-close report so one problem does not read as two. "both" prints it again at close, where the count is final.
This governs the built-in reporter. A custom reporter owns the output and is never printed behind; use onFinding for live handling alongside it.
configure({
  threshold: 5,            // distinct repetitions before it counts as N+1
  duplicateThreshold: 2,   // identical repetitions before it counts as duplicate
  mode: "warn",            // "warn" | "throw" | "silent"
  reportWhen: "scope-close", // "scope-close" | "immediately" | "both"
  detectParent: true,      // guess the query the loop iterates over
  statements: ["select"],  // restrict to certain statement kinds
  ignore: [/pg_catalog/],  // skip queries matching these
  captureStack: true,      // attribute queries to a line of code
  maxQueries: 10,          // report a scope over this many queries (off by default)
  sampleValues: 5,         // show up to 5 differing values on an N+1 (off by default)
  autoScope: false,        // group unscoped queries heuristically (see above)
  autoScopeIdleMs: 50,     // idle gap that ends an inferred scope
  onFinding: (f) => metrics.increment("n_plus_one", { scope: f.scope }),
  reporter: (summary) => logger.warn(summary),
  enabled: process.env.NODE_ENV !== "production",  // the default
});
mode: "throw" raises an NPlusOneError at the query that crosses the threshold — useful in staging when you want the failure to be loud.
record() is public API, so any driver takes a few lines:
import { record } from "nplusone";

const original = driver.execute;
driver.execute = async function (sql, params) {
  const started = performance.now();
  try {
    return await original.call(this, sql, params);
  } finally {
    record({ sql, params, durationMs: performance.now() - started });
  }
};
Contributions very welcome — the adapters in src/adapters/ are around 100 lines each and share the helpers in shared.ts.
npm test          # 177 tests, including real queries against node:sqlite
npm run coverage # 80% lines, 83% branchesThe suite runs on all three in CI, so this table does not rot.
| Runtime | Detection | Attribution | |
|---|---|---|---|
| Node 18 – 24 | ✅ | ✅ | ✅ |
| Deno 2.x | ✅ | ✅ | ✅ |
| Bun 1.3 | ✅ | mostly — see below |
Deno passes the whole suite. It source-maps Error.stack, which used to
break attribution outright: this library's own frames arrived named
src/callsite.ts while the files on disk were dist/callsite.js, so they were
not recognised as ours and every finding was blamed on the library's own
internals. Fixed in 0.9.0 by asking the runtime what it calls this file rather
than guessing from the build layout.
Bun detects N+1s correctly and attributes them correctly in ordinary code.
The caveat is JavaScriptCore rather than Bun: it eliminates a stack frame in two
cases V8 keeps — a call in tail position (return db.query(...) as the last
statement, which is ES6 proper tail calls) and a function small enough to be
inlined. When either happens the frame does not exist to be read, and the
report names the caller instead. In practice this hits thin one-line wrappers;
a handler or repository method that does real work keeps its frame. Nothing here
can fix that, so it is measured and stated instead.
Also on Bun: node:sqlite is not implemented in 1.3, so instrumentNodeSqlite
has nothing to instrument. better-sqlite3 is unaffected.
The real expense is capturing a stack trace per query. That used to be an assertion; npm run bench makes it a number:
node v24 · 20,000 queries × 9 samples (median)

  detector disabled                    20 ns/query            —   the floor
  captureStack: false                1488 ns/query     +1468 ns   detection without attribution
  captureStack: true (default)      12476 ns/query    +12456 ns   stackDepth 30, the shipped default
  captureStack, stackDepth: 8        9869 ns/query     +9849 ns   a shallower walk
  instrumentDrizzle, 4-call chain   48579 ns/query    +48559 ns   one capture per chained call
Read the gaps, not the absolutes — those move with hardware and Node version. Three things worth taking from it:
- Attribution is ~90% of the cost. Turning it off with
captureStack: falsekeeps detection and makes the detector roughly eight times cheaper — cheap enough to leave running in staging. instrumentDrizzlecosts about four times a plain query, because fixing attribution for helper-built queries (#12) means capturing on every chained call rather than once. That is the price of a correct line number for Drizzle, it is paid in development only, and #23 is about bringing it down.- Even the default is ~12µs per query. A request issuing fifty queries pays under a millisecond. That is invisible in development and is why the detector is disabled when
NODE_ENV === "production"unless you explicitly enable it.
Scopes retain up to 10,000 queries each; past that, counting continues but individual queries stop being kept, so a long-lived scope cannot grow without bound.
Worth knowing before you file an issue:
- Queries with no application frame on the stack — a lazy ORM executing from its own internals, or a pool issuing queries from a background task — are grouped by statement shape alone and reported as
<unknown call site>. For Drizzle this is exactly whatnplusone/drizzlefixes; for an ORM without an adapter yet, the finding still tells you which statement is looping. - A fully encapsulated query builder still reports the helper. If the whole chain lives inside
function q(id) { return db.select().from(items).where(eq(items.id, id)) }, every building call happens in the helper and no application frame anywhere names the loop. The finding is accurate about the statement; the line is the closest one that exists. - A legitimate batch loop (a script importing rows one at a time) looks exactly like an N+1 from the driver's point of view. Use
statements: ["select"]orignoreto quiet it. - Cursors and streaming queries (
pg.Cursor,pg-query-stream) carry no statement text at the patch point and are not recorded. AsyncLocalStorageis required for scope propagation. Code that breaks async context will report queries outside any scope, and you get one warning saying so.- Prisma and MongoDB report operations, not SQL (
User.findUnique,users.findOne) — that's the call you would batch, so it's the more actionable label, but it is not the raw statement. - MongoDB cursors (
find,aggregate) are recorded when the cursor is created rather than when it is drained, so no duration is reported for them.
Not just unit tests. Each release is run against real stacks, and the last one found three bugs that fixtures never would have:
- Next.js bundling gives a route its own copy of the library, so the scope
and the driver ended up on two different
AsyncLocalStorageinstances and nothing was detected. Shared state is now process-global. - Transaction control (
BEGIN/COMMIT) was reported as duplicated work, burying real findings under ORM bookkeeping. - Lazy ORMs execute from a thenable, so the caller's frame is gone by the
time the driver runs. Hence
nplusone/drizzle.
This library is better than one person could have made it. Thank you:
| Contribution | |
|---|---|
| @snowyukitty | Made libSQL transactions visible (#22) — queries inside transaction() were being recorded nowhere at all, which reads as a clean bill of health |
| @milekv | The libSQL / Turso adapter (#13) — including the decision to record each batch() statement separately, which is what keeps a batch loop from hiding an N+1 |
| @TarekHassan1 | The runnable Express + PostgreSQL example (#11) — docker compose up, hit two endpoints, see the difference |
| @blut-agent | Made the report's colour handling testable (#7) and covered every path — NO_COLOR, TERM=dumb, non-TTY and TTY |
| Mads Hansen | Spotted that attribution names the wrong line when a query is built in one place and executed in another (#12) — the bug behind the 0.6.0 fix |
There are good first issues open right now, and CONTRIBUTING.md walks through writing an adapter — they are about 100 lines each and share the helpers in shared.ts.
Two things worth knowing before you start:
- Measure before you theorise. Nearly every real bug in this library was found by dumping the actual stack or running against a real database, and several plausible theories died that way. If an issue asks you to post a measurement, that measurement is valuable even if you stop there.
- Say what you chose and why. Most of these decisions are trade-offs rather than right answers. A PR that explains the reasoning gets reviewed faster than one that hides it.
MIT