Conversation
|
I didn't add any colourmaps because I looked at how many you had in your spectogram repo and had a stroke. I assume they are generated programmatically, but still. If we add that many I think we should ditch passing them in by enum and just pass an instance of the class (like VectorField does it). Otherwise you'll have a page of switch/case. As for axes, that sounds like a hefty refactor, and I think heatmaps need axes less than most plot types anyways. I'm not sure if the refactor is likely to be worth the effort. |
Ha, yeah, I'm still working on this. Because of licensing issues with the originals I think I need to re-derive my own colormaps, which probably involves creation of a GUI tool to help this, but I think I can do it better if real curves (or bezier splines?) are used to generate the colormap. Hopefully by doing this I can create some truly open colormaps that can be easily used for other projects too, but I recognize this is a good bit of work and a potential distraction I shouldn't embark on immediately. And yes, I generated those colormap classes programatically
Up to you! It's definitely a feature we could implement in the future if we decide to leave it like it is for now. |
Turbo, viridis, etc are fine. It's the ones derived from "colorbrewer" palettes I feel are obnoxious, and I don't want the end users of ScottPlot to have to carry around colorbrewer license files like matplotlib does 😝 |
I'll leave it for now. I just added a parameter to disable the labels because that seems like a good idea. |
|
Possible license solution: Plotly has fantastic colormaps. It seems they are MIT licensed. https://youtu.be/o9KxYxROSgM Also, apparently there's a plotcon? 🤣 |
|
I think cmocean is MIT too, even from matplotlib https://matplotlib.org/cmocean/ |
|
cmocean is MIT, and so is plotly, but some of plotly's colourmaps are under different licenses. Her talk was pretty interesting, I think her dissolved O2 one highlights the need for users to make custom colourmaps. I think that specific one is part of cmocean but I wouldn't have thought that there is so much domain-specific nuance. I always wondered why matplotlib has 20 million different colourmaps. |
|
Also I feel like we'll have to add some documentation for when to use each one |
|
I think the cookbook could use a little something like this: Just so it's easy to find which colourmap you want without trying each one. I'll look at plotly colourmaps as well but I gotta take care of something right now. In case you need to change anything (i.e. I made a mistake) the script I used is below: import sys, argparse
parser = argparse.ArgumentParser()
parser.add_argument('--name')
args = parser.parse_args()
#print(args.name)
cmap_raw = sys.stdin
cmap = []
for line in cmap_raw:
cmap.append(list(map(lambda l: float(l), line.split(' '))))
output="""//This is a cmocean colormap
//All credit to Kristen Thyng
//This colormap is under the MIT License
//All cmocean colormaps are available at https://github.com/matplotlib/cmocean/tree/master/cmocean/rgb
namespace ScottPlot.Config.ColorMaps
{
"""
output += f"public class {args.name} : ColormapFromByteArray"
output += """
{
protected override byte[,] cmap { get { return cmaplocal; } }
private static readonly byte[,] cmaplocal = {
"""
for i in cmap:
output+= "\t\t\t{" + f" {str(round(i[0] * 255))}, {str(round(i[1] * 255))}, {str(round(i[2] * 255))} " +"},\n"
output = output[:-2] + "\n"
output += """
};
}
}
"""
print(output)And I used it like this: python .\script.py --name Turbid > C:\Users\benny\source\repos\ScottPlot\src\ScottPlot\Config\ColorMaps\Turbid.csI'm sure I didn't do it the p y t h o n i c way, seeing as I rarely use python, so don't judge me. |

|
Two of the colourmaps (Curl and Delta) are snowflakes, they have 512 colours. Which means you should use this script instead: import sys, argparse
parser = argparse.ArgumentParser()
parser.add_argument('--name')
args = parser.parse_args()
#print(args.name)
cmap_raw = sys.stdin
cmap_list = []
cmap = []
line_count = 0
for line in cmap_raw:
cmap_list.append(line)
line_count+= 1
snowflake = line_count == 512 #Curl and Delta are snowflakes
i = 0
for line in cmap_list:
if(not (snowflake and i % 2)):
cmap.append(list(map(lambda l: float(l), line.split(' '))))
i += 1
output="""//This is a cmocean colormap
//All credit to Kristen Thyng
//This colormap is under the MIT License
//All cmocean colormaps are available at https://github.com/matplotlib/cmocean/tree/master/cmocean/rgb
namespace ScottPlot.Config.ColorMaps
{
"""
output += f"public class {args.name} : ColormapFromByteArray"
output += """
{
protected override byte[,] cmap { get { return cmaplocal; } }
private static readonly byte[,] cmaplocal = {
"""
for i in cmap:
output+= "\t\t\t{" + f" {str(round(i[0] * 255))}, {str(round(i[1] * 255))}, {str(round(i[2] * 255))} " +"},\n"
output = output[:-2] + "\n"
output += """
};
}
}
"""
print(output)I also added a demo which shows all the colourmaps. The only thing is the colourmap demos display with height of 400, when realistically they only need a height of 100. In the cookbook it looks like this:
In my opinion it looks a little comical. I modified the cookbook generator so it creates something like this:
The WPF and Winforms demos are unchanged, they look like this:
I think the WPF and Winforms demos are fine but feel free to change them if you like. These demos are mostly for the cookbook anyways, most people don't need a fully interactive plot to see what a colour looks like. |


|
I'm looking at plotly's colourmaps, they have these:
Note that there are a lot of duplicates, for example, qualitative includes colorbrewer and carto colourmaps. And their MIT licensed stuff also includes things like Viridis, which are not under MIT license (although because their license is so lax they can be relicensed under MIT) Even better, they are in a weird format, they are given in terms of colourstops: I couldn't find the code for interpolating between them but it'll be there somewhere. If it's a linear interpolation that wouldn't be so bad but given my experience with their javascript library it probably looks something like this:
And I am aware that the sigmoid function is not defined for vector inputs, I was worried that the equation might look too comprehensible. |


@Benny121221 There's a lot of great content in this PR here, thanks for all your awesome work on this! I'm burred in axis/tick land this weekend, so I won't dive into the colormap code myself quote yet. I just saw that YouTube and thought of you and this PR. Unfortunately it looks like those colormaps aren't all as freely licensed or as simple as I initially thought! That's a bummer. Maybe a good strategy for now is to build in all the simple MIT-licensable colormaps we can find (from matplotlib, plotly, etc.) while also making it easy for users to input their own custom colormaps. A little custom tool (perhaps in the /dev folder?) to flip through all the available colormaps would be nice for testing. To populate a listbox of all colormaps and easily retrieve them later for my spectrogram library I implemented a GetColormaps() method using reflection which eliminates the need for if and switch statements as colormaps are added and removed. Long term it may be nice to create a colormap creation tool in the /dev folder that uses splines (similar to the tool used to create Turbo). Such a tool could utilize plotting to let you visualize the R, G, B, and mean curves as you edit the colormap, as well as display the colormap itself (as a linear strip, and also as a sample heat map). We could use it to create some MIT-licensed colormaps designed to mimic (but not copy) the more restrictively-licensed common alternatives. |
|
Not sure how helpful it is, but messing around I created an impromptu colormap generator. It currently doesn't have a means to output values, but it's an easy starting point in case we decide to create original colormaps inspired by ones with complex licenses. I'll upload the code now and tag this PR in the commit message. It may also benefit from improved interpolation #459 or maybe something smarter than 5 trackbars 😅
|

|
I took the colormap demo out of the cookbook and gave it its own form I probably won't make the WPF version until heatmaps development is finished. I think this PR is about ready to merge... I added this to the cookbook. It demonstrates me line of thinking where colormaps are useful beyond heatmaps. |


|
There were a few issues with the colourmap viewer, the big one was it would crash if minimized. There was also an issue which could cause the zoom and axis of the heatmap to be broken if you switched between the image and the gaussian sample data. I fixed them both. |
|
I'm not a fan of getting rid of the official turbo colourmap, I know you're not a fan of having multiple license documents, but I don't think the NOTICE file was too bad. Regardless, it may be worth ironing out a few inconsistencies: Original Turbo: Your copy: The differences aren't profound, but they are noticeable. Your greens are darker and take up more of the colourmap. Your oranges also start later and have a peachey tinge. |


I mean this not as a criticism, but I think trying to mimic a colourmap is going to be very difficult to get perfect, and it would likely be easier to just leave the notice in. The differences probably wouldn't cause any trouble if someone was using only ScottPlot, however, if someone used matplotlib and ScottPlot, or even if they were just comparing data with someone who used another plotting library it could get confusing. |
|
Here's my line of thinking on Turbo, and I welcome objective criticism! It's not difficult for us just to use the real Turbo and add a NOTICE file. However, GitHub says this package is used by 97 others, so I want to make sure nothing we do results in those 97 others having to create "this product contains a modified version of the Turbo colormap" notice file in each of their repos. According to my understanding, that notice file then has to get carried along the build chain, through packaging, and all the way to the end-user, so some the laptop of some person using a stock market analysis app that has a ScottPlot in it somewhere has to have this notice file on their hard drive or in the application documentation. Including this notice is a small inconvenience, but it scales, so I wish to avoid it. My goal in mimicking Turbo wasn't to duplicate it, but rather to provide something that was similar to but not derived from it. Copying the magic formula from the polynomial approximation would have been the simplest way to duplicate it. If you can think of something we can do to make it better (or think we should just remove it), I'm interested in what you think! I'm also colorblind, so maybe I'm not the best person to be trying to mimic a colormap by eye 🙃 |
Thanks for fixing these! I keep forgetting zero-pixel-size Bitmap instantiation throws an exception 🙈 Great catch! |
The relevant portion of the Apache 2.0 License is below. Note that "Work or Derivative Works" include both source and object form.
The sticklers are 4a) and 4d) as they apply to source and object files. 4a means the github repo and NuGet both need to have copies of the license 4d means we do not need to include the notice file as I had thought, as the original does not include one. In my opinion, distributing the license through NuGet isn't too bad. What would be a real pain is if Steve makes a project which uses ScottPlot and they were required to distribute the license as well. I think a derivative work of ScottPlot would unfortunately count as a derivative work of Turbo. The definition of derivative work is below:
I do have a sneaky way around this but I have a feeling you won't like it (as I don't like it either). You could create another NuGet package which adds Turbo (and any other colourmap with potentially problematic licensing) and clearly outlines the obligations of anyone using the package. Or you could see if you could get permission to use it under a proprietary license. This seems unrealistic however, as the copyright is to Google LLC, not Anton Mihailov. I'm sure it is worth a try but I wouldn't hold your breath. |
As for mimicking it, I don't have any ideas other than brute force. You could modify the colourmap generator to have 80 stops and it would probably be identical. But that seems unreasonable. In my opinion it is very close as it is and it would be accurate enough with a few extra stops. |
A few extra spline interpolation stops probably would do the trick. This would require some pretty significant modifications to the spline interpolation colormap generator application (in the dev folder), so rather than halt heatmap progress to work on a colormap generator application I'll go ahead and merge this in and make a note to come back later and create better tools for custom colormap generation. Such a program probably deserves its own project/repository independent of ScottPlot... Thanks again for all your help on these heatmap and colormap features! This is turning out to be really impressive |
|
@Benny121221 I almost missed all the excellent notes you made in #458 (comment)
I'm reassured that your reading of the license resulted in a similar conclusion with mine! Also, what a pain that license is turning out to be. After this saga, I really think there's a potential market for a tool (perhaps a SPA?) where users can (1) copy/paste common MIT-licensed colormaps into their language of choice, and (2) use sliders to create their own custom colormaps. Turbo is a nice colormap, but truly free no-obligation resources are better 🤔 We could invent the next Turbo! TurboCharge colormap? Actually it's free so TurboNoCharge 😜 |
I'm intrigued, and I have a lot of experience with SPAs, so let me know if you want any help.
Why not SuperCharge, better low-end torque? |
I'm intrigued at the prospect, but considering how much I've got on my plate these days it's something I know will take a few months before I can get to it. I'll keep noodling the idea and if/when it starts moving I'll let you know! It seems like a super specific tool, probably only useful to a small sliver of library developers, so it's hard to assess its impact or true utility. It seems like 99.9% of people can just grab an existing colormap and move on.
Ha, I like it! "SurperCharge, the public domain alternative to Google's Turbo colormap". |
New contributors should review CONTRIBUTING.md
Purpose:
#457
XYToIntensities creates a rectangular intensities array from xy coordinates:
It supports both gaussian and density intensity modes.
The following parameters have been added to
Plot.PlotHeatmap:scaleMinandscaleMaxallow modifying the scale.transparencyThresholdallows mapping intensities below it to transparent (0x00000000)backgroundImageanddisplayImageAboveallow adding a background image and displaying it above or below the heatmap.New functionality (image):
Modified Heatmap scale:
In this instance it looks less vibrant as the scale has effectively capped the range
Heatmap from XY Data:
Gaussian:
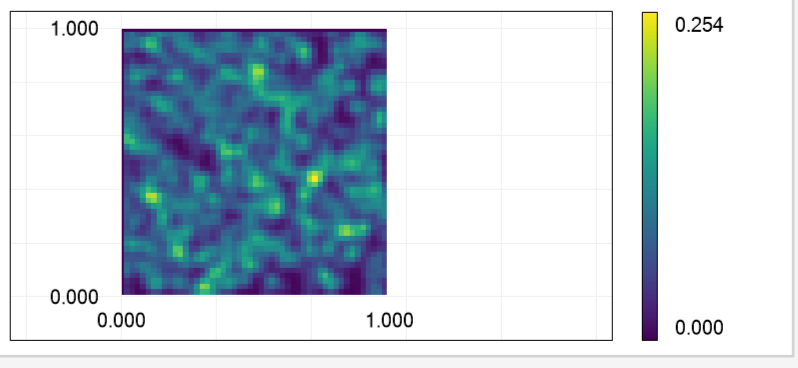

Density:
Note these are not generated from the same data, these are randomized.
Background Image:
Autoformat your code:
The build will fail if your code is not auto-formatted. Auto-format your code in Visual Studio, or from the console using these commands: