Conversation
|
Good catch! I thought this was a regression from #1188 but it looks like it always acted this way. I have two small questions:
|
|
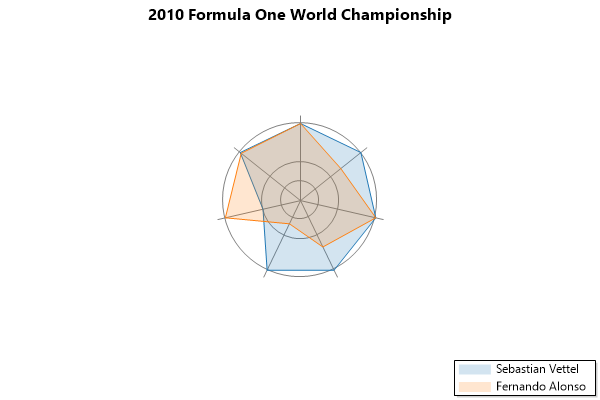
As a reminder, this is what we're discussing double[,] values = {
{ 5, 3, 10, 15, 3, 2, 256 },
{ 5, 2, 10, 10, 1, 4, 252 },
};
var radar = plt.AddRadar(values, independentAxes: true);
radar.CategoryLabels = new string[] { "Wins", "Poles", "Podiums", "Points Finishes", "DNFs", "Fastest Laps", "Points" };
radar.GroupLabels = new[] { "Sebastian Vettel", "Fernando Alonso" };
radar.ShowCategoryLabels = true; // <-- this is what we are discussing
plt.Title("2010 Formula One World Championship");
plt.Legend();
Original Behavior / Issue this PR fixes
This seems like a good fix! Thanks @Rayffer
@bclehmann I imagine the majority of people will want to show the labels if they go through the effort of populating them, and this is probably easy enough to figure out that an explicit example isn't required.
Is this variable actually necessary? What if we simplified the rule to "if category labels exist, show them". This property could be refactored to something like: private bool ShowCategoryLabels => CategoryLabels is not null;I'll go ahead and merge this now but if you think a change would make radar plots easier to use feel free to open-up a new PR to refine this behavior 👍
I'm pretty comfortable with small breaking changes if it makes the library less confusing for future users 😎 |

Purpose:
This pull request intends to give RadarPlot users the option to show category labels instead of it being shown when IndependentAxes property is set to true. Solves #1261
New Functionality:
There is no new functionality apart from giving the RadarPlot users direct control whether to show category labels or not.