MutiAxis:HorizontalLine position label can‘t show in additional axis #1766
Description
ScottPlot Version: 4.1.39
Operating System: Windows 11 21H2
Application Type: WinForms
Question: I want to show position label in additional axis (YAxisIndex is above 1), but it only render in primary axis (YAxisIndex is 0). HLine.YAxisIndex and SignalPlot.YAxisIndex are set correctly.
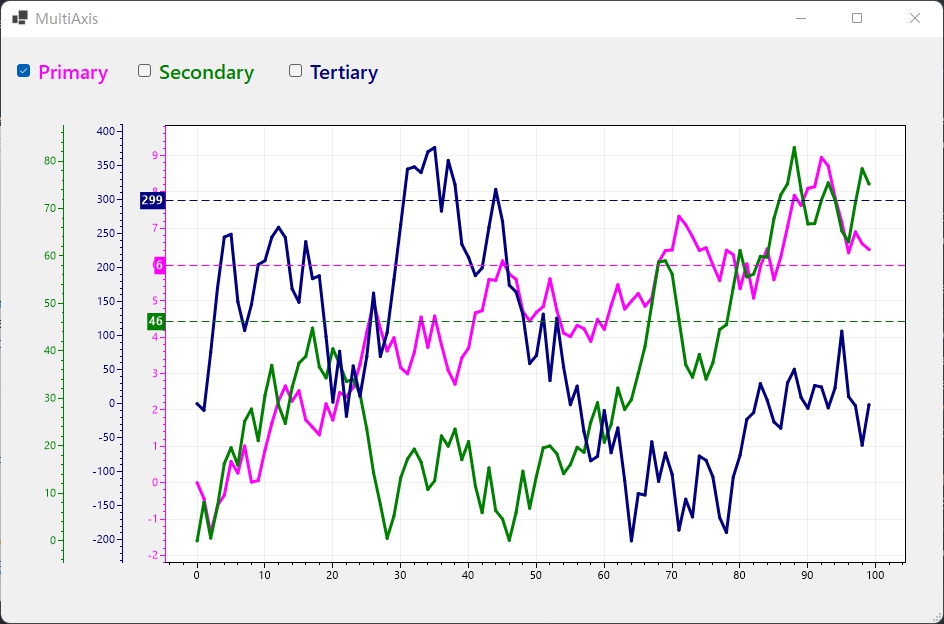
the example code is modified from WinFormsDemos MultiAxisLock.
    public partial class MultiAxisLock : Form
    {
        private readonly ScottPlot.Renderable.Axis YAxis3;
        private readonly ScottPlot.Renderable.Axis YAxis4;

        public MultiAxisLock()
        {
            InitializeComponent();

            Random rand = new Random();
            double[] data1 = DataGen.RandomWalk(rand, 100, mult: 1);
            double[] data2 = DataGen.RandomWalk(rand, 100, mult: 10);
            double[] data3 = DataGen.RandomWalk(rand, 100, mult: 100);
            double avg1 = data1.Sum() / data1.Length;
            double avg2 = data2.Sum() / data2.Length;
            double avg3 = data3.Sum() / data3.Length;

            // Add signals specifying the vertical axis index for each
            var plt1 = formsPlot1.Plot.AddSignal(data1);
            plt1.YAxisIndex = 0;
            plt1.LineWidth = 3;
            plt1.Color = Color.Magenta;

            var plt2 = formsPlot1.Plot.AddSignal(data2);
            plt2.YAxisIndex = 3;
            plt2.LineWidth = 3;
            plt2.Color = Color.Green;

            var plt3 = formsPlot1.Plot.AddSignal(data3);
            plt3.YAxisIndex = 2;
            plt3.LineWidth = 3;
            plt3.Color = Color.Navy;

            // Add draggable horizontal lines specifying the vertical axis index for each
            var hline1 = formsPlot1.Plot.AddHorizontalLine(avg1);
            hline1.DragEnabled = true;
            hline1.Color = plt1.Color;
            hline1.LineStyle = LineStyle.Dash;
            hline1.YAxisIndex = 0;
            hline1.PositionLabelBackground = plt1.Color;
            hline1.PositionFormatter = (double position) => position.ToString("N0");
            hline1.PositionLabel = true;

            var hline3 = formsPlot1.Plot.AddHorizontalLine(avg3);
            hline3.DragEnabled = true;
            hline3.Color = plt3.Color;
            hline3.LineStyle = LineStyle.Dash;
            hline3.YAxisIndex = 2;
            hline3.PositionLabelBackground = plt3.Color;
            hline3.PositionFormatter = (double position) => position.ToString("N0");
            hline3.PositionLabel = true;

            var hline2 = formsPlot1.Plot.AddHorizontalLine(avg2);
            hline2.DragEnabled = true;
            hline2.Color = plt2.Color;
            hline2.LineStyle = LineStyle.Dash;
            hline2.YAxisIndex = 3;
            hline2.PositionLabelBackground = plt2.Color;
            hline2.PositionFormatter = (double position) => position.ToString("N0");
            hline2.PositionLabel = true;

            formsPlot1.Plot.YAxis.Color(Color.Magenta);

            // Create additional vertical axis and customize it
            YAxis3 = formsPlot1.Plot.AddAxis(Renderable.Edge.Left, 2);
            YAxis3.Color(Color.Navy);

            YAxis4 = formsPlot1.Plot.AddAxis(Renderable.Edge.Left, 3);
            YAxis4.Color(Color.Green);

            formsPlot1.Plot.AxisAuto();
            SetLocks();

            formsPlot1.Refresh();
        }

        private void SetLocks()
        {
            formsPlot1.Plot.YAxis.LockLimits(!cbPrimary.Checked);
            YAxis4.LockLimits(!cbSecondary.Checked);
            YAxis3.LockLimits(!cbTertiary.Checked);
        }

        private void cbPrimary_CheckedChanged(object sender, EventArgs e) => SetLocks();
        private void cbSecondary_CheckedChanged(object sender, EventArgs e) => SetLocks();
        private void cbTertiary_CheckedChanged(object sender, EventArgs e) => SetLocks();
    }