Drag zoom affects first and second axes in different manners #1537
Description
Bug Report
Issue:
I am unsure whether this is a true bug report or a wrong use of the tools on my part, so if it is (not a bug), sorry in advance for the inconvenience.
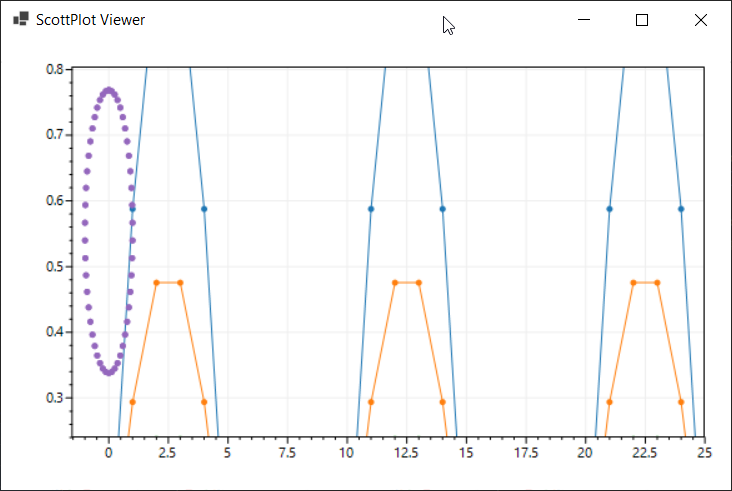
When plotting quantities on the first and second (at least Y) axes, zooming in and out using the scroll or the drag zoom affects plottables with different AxisIndex in different fashions, resulting in relative size between such plottables being different.
I would have expected that the zoom would not affect relative sizes between plottables, but just the axis limits (if such limits are free of course).
Another remark, but this could take the form of a feature request, in addition/extension to the LockAxisLimits, it may be relevant to give the possibility to only lock one of the limits. This could be interesting in the case where power density or some bars are plotted and one wants to zoom to see small contributions, but not lose the fact that the lower limit has to remain 0.
See the screenshots below
- Initial plot

- Drag zoom

- Result of zoom
Note that click the central mouse button returns to the correct initial plot
Reproducing: (What do others have to do to reproduce the bug?)
// a code sample may improve communication
namespace live_sandbox
{

    public static class Program
    {
        public static void Main()
        {
            // create a plot
            var plt = new ScottPlot.Plot();
            plt.AddSignal(ScottPlot.DataGen.Sin(51,5));
            plt.AddSignal(ScottPlot.DataGen.Sin(51, 5,0,0.5));
            plt.AddSignal(ScottPlot.DataGen.Sin(51, 5,0,0.25));
            plt.AddSignal(ScottPlot.DataGen.Sin(51, 5, 0, 0.125));

            var yaxis1plot = plt.AddScatterPoints(ScottPlot.DataGen.Sin(51), ScottPlot.DataGen.Cos(51));
            yaxis1plot.YAxisIndex = 1;
            plt.Add(yaxis1plot);


            // launch the plot in an interactive window
            var window = new ScottPlot.FormsPlotViewer(plt);
            window.ShowDialog();
        }
    }
}
System Details
- ScottPlot Version: 4.1.29
- Operating System: Windows 10
- Application Type: WinForms
- .NET Version: NET Framework 4.7.2