Frame: Unexpected behavior across Frame(), Frameless(), and AddRadar() #1112
Description
Frame around RadarPlot
Description: When adding a RadarPlot the default settings give the plot a frameless appearance. Aesthetically, frame around the radar plot area might be preferred by some users, so the natural option is to call the Frame() method to draw the frame around. However, only the top and left frames are drawn, while the right and bottom are not.
Code example: The following code shows this unexpected behavior.
var plt = formsPlot1.Plot.AddRadar(_plotLux);
formsPlot1.Plot.Frame(visible: true);
This is not a big problem, since an approximated-framed RadarPlot (please note that the data area does not go right up to the edge of the plot) can actually be obtained, although it's slightly counterintuitive because the AddRadar function enables both the frame and the grid at the same time.
var plt = formsPlot1.Plot.AddRadar(_plotLux, disableFrameAndGrid: false);
formsPlot2.Plot.Grid(enable: false);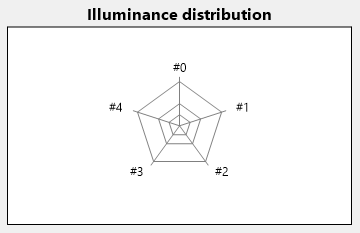
What's causing the issue?
The AddRadar method doesn't allow for independently disabling the frame and the grid:
ScottPlot/src/ScottPlot/Plot/Plot.Add.cs
Lines 729 to 745 in c18fd88
Going down the rabbit hole, the Frameless() function is implemented this way:
ScottPlot/src/ScottPlot/Plot/Plot.Axis.cs
Lines 94 to 98 in 6713c46
And the code for hiding each axis is:
ScottPlot/src/ScottPlot/Renderable/Axis.cs
Lines 398 to 406 in 8d516f7
It appears that hiding the axis also sets the private property PixelSizePadding to 0 (the one causing the issue). However, calling the Frame() method, as shown in the code at the very beginning, does not reset the value of this property, thus causing the bottom and right frames not to be drawn.
ScottPlot/src/ScottPlot/Plot/Plot.Axis.cs
Lines 77 to 88 in 6713c46
It's slightly counterintuitive that Frame() method just modifies the axis Visible property while the Frameless() method modifies the Visible and the three PixelSize... properties.
Possible solutions:
- Call
AddRadardisabling frame and grid; later enable the grid (as shown above). That's effective but counterintuitive. This keeps the plot's data area smaller than the plot control. - Modify the
Frame()method in order to set back the threePixelSize...properties to their default values when thevisibleparameter is set totrue. Note that thePixelSize...properties are private; and keep in mind that modifying them might cause unwanted side-effects. - Modify the
Frameless()method so thatPixelSizePaddingis set equal to 1 (that's enough to allow the bottom and right borders to be drawn when callingFrameless()first andFrame()later). This is the most radical solution, but it might not be appropriate in other contexts.