How to enable engineering notation for tick labels (multiplier notation) #1046
-
|
The current functionality of the TickLabelNotation is really nice for maximizing graph size and minimizing label space consumption. It would be even nicer, for my use case at least, to have a switch setting to limit the powers to Engineering Notation (i.e., multiples of 3), with the digits limited to > -1000 and < 1000 |
Beta Was this translation helpful? Give feedback.
Replies: 7 comments 1 reply
-
|
Hi @garyblythe, thanks for the suggestion!
Do you have an example plot showing this type of notation? It might be helpful at better understanding this use case. I added this topic to the triaged task list (#1028) and refactoring the tick system and adding new functionality is very high in the list of upcoming projects. However this isn't an immediate focus of active work, so I'll close this issue and follow-up when work on this goal begins. |
Beta Was this translation helpful? Give feedback.
-
|
Scott,
|

Beta Was this translation helpful? Give feedback.
This comment has been hidden.
This comment has been hidden.
This comment has been hidden.
This comment has been hidden.
-
|
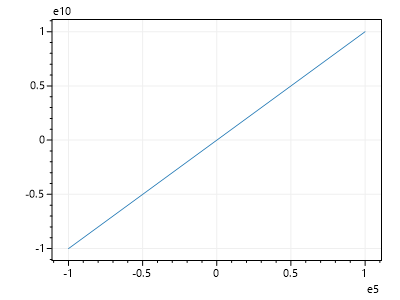
I was mistaken! This is working: var plt = new ScottPlot.Plot(400, 300);
plt.AddLine(-1e5, -1e10, 1e5, 1e10);
plt.SaveFig("default.png");
plt.XAxis.TickLabelNotation(multiplier: true);
plt.YAxis.TickLabelNotation(multiplier: true);
plt.SaveFig("multiplier.png");
https://swharden.com/scottplot/cookbooks/4.1.13-beta/category/advanced-axis-features/#multiplier-notation The cookbook examples are working too, but they're just being demonstrated on one axis, so I overlooked it. I'll modify them to make it more obvious. |

Beta Was this translation helpful? Give feedback.
-
|
Scott, the original two comments stand as a feature request (how it was originally submitted). What I'm looking for is the multiplier (scientific notation) gated by powers of 10^3, commonly referred to as "Engineering Notation". Ideally, the picture above would show 0-30 on the Y-axis, with e6 as the power (of 10) multiplier. The "thick red line" varies between 5 and 10 Mbps (0.5 * 10^7 or 5.0 * 10^6). It's far easier for the average audience to consume kilo, mega, giga, etc. I can obviously write my own auto scaling, but I was hoping the library could adapt the existing implementation to offer this minor change... |
Beta Was this translation helpful? Give feedback.
-
|
I cannot get the multiplier to show up next to my axes. This is how my default and multiplier versions of your AddLine example are saved when I use the latest version 4.1.19 (same in 4.1.17). |


Beta Was this translation helpful? Give feedback.
-
|
Hi @DavidBergstromSWE, thanks for reporting this! This is indeed a bug and I started issue #1252 to track progress fixing it. Hopefully this can get fixed and released into a new package on NuGet quickly 🤞 |
Beta Was this translation helpful? Give feedback.
I was mistaken! This is working:
https://swharden.com/scottplot/cookbooks/4.1.13-beta/category/advanced-axis-features/#multiplier-notation
https://swharden.com/scottplot/cookbooks/4.1.13-beta/category/advanced-axis-features/#offset-notation
The cookbook examples are working too, but they're just being demonstrated on one axis, so I overlooked it. I'll modify them to make it more obvious.