[Performance] Issue with mongodb and rocket chat #22132
Description
Description:
On a new 3.14 RocketChat version load increased both for RocketChat app (we use docker containers) and mongodb server.
Today we have very strange load increasing on mongo and then on all RocketChat instances.
mongodb
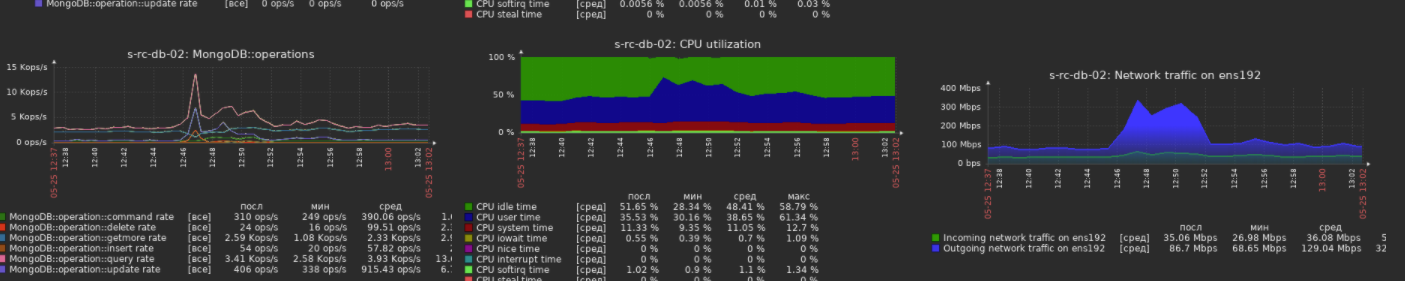
RocketChat servers
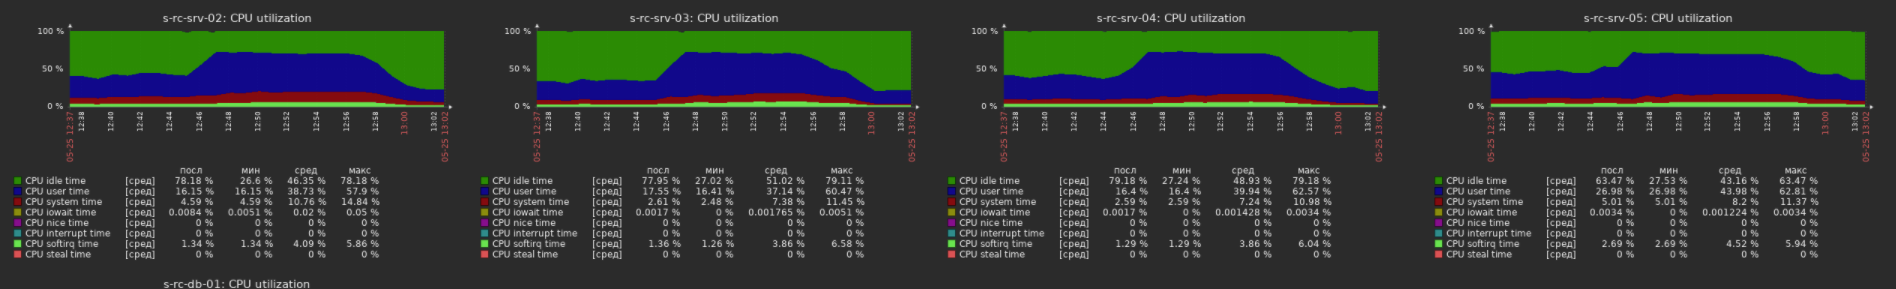
I fixed that really strange and big load peak by disabling Presence Broadcast and then load come to normal.
But really strange thing about what I'm making that issue is what actually mongo did in that problem period.
Here is a all stuff that mongo did in problem period.
Here is left digits is per day and right digits is per problem time
   2311 ACCESS	15
5845290 COMMAND 91698
     13 CONTROL 0
      9 INDEX	0
   8683 NETWORK	60
    270 QUERY	165
      6 REPL
      1 SHARDING
     83 STORAGE	3
   4272 WRITE	70
As you can see, almost all mongo work is COMMAND commands. That normal I guess, no problems.
And now most interesting thing - what collections used in that COMMAND work.
  10316 rocketchat.rocketchat_roles
  10310 rocketchat.rocketchat_permissions
  10308 rocketchat.rocketchat_integrations
  10302 rocketchat.rocketchat_settings
  10301 rocketchat.rocketchat_livechat_inquiry
  10300 rocketchat.meteor_accounts_loginServiceConfiguration
  10297 rocketchat.rocketchat_integration_history
  10294 rocketchat.rocketchat_email_inbox
  10289 rocketchat.rocketchat_livechat_department_agents
   8225 rocketchat.instances
   5482 rocketchat.rocketchat_message
   1257 rocketchat.rocketchat_subscription
    864 rocketchat.rocketchat_room
    694 rocketchat.users
    371 rocketchat.usersSessions
    102 rocketchat.$cmd
     33 config.$cmd
      7 rocketchat._raix_push_app_tokens
      2 rocketchat.rocketchat_message_read_receipt
      1 local.oplog.rs
Important note - we don't use livechat at all, never enabled it, all livechat collections are empty.
I guess that normal messaging load would be on collections like rocketchat.rocketchat_message, rocketchat.rocketchat_subscription and rocketchat.rocketchat_room. That's is logic.
But as you can see - most high loaded collections are very strange (most strange livechat collections as I mentioned earlier).
That's all looks like RocketChat went crazy and start working with that collections so hard for some reason.
Here is example of one of that strange COMMAND
2021-05-25T12:45:00.119+0300 I COMMAND [conn2111] command rocketchat.rocketchat_livechat_inquiry command: getMore { getMore: 6061431149618761376, collection: "rocketchat_livechat_inquiry", batchSize: 1000, lsid: { id: UUID("aa0c3ca8-3875-4d7b-8c0b-06ab04b4a3d7") }, $clusterTime: { clusterTime: Timestamp(1621935899, 16), signature: { hash: BinData(0, B78AF34790775CF55CEA7F6CDD8CA2CD3C6F07FB), keyId: 6920770581193293826 } }, $db: "rocketchat" } originatingCommand: { aggregate: "rocketchat_livechat_inquiry", pipeline: [ { $changeStream: { fullDocument: "default" } } ], cursor: {}, lsid: { id: UUID("aa0c3ca8-3875-4d7b-8c0b-06ab04b4a3d7") }, $clusterTime: { clusterTime: Timestamp(1621894217, 82), signature: { hash: BinData(0, AD5024B24184C96813F548844FA2934F4D478E4E), keyId: 6920770581193293826 } }, $db: "rocketchat" } planSummary: COLLSCAN cursorid:6061431149618761376 keysExamined:0 docsExamined:149 numYields:179 nreturned:0 reslen:358 locks:{ Global: { acquireCount: { r: 182 } }, Database: { acquireCount: { r: 181 } }, oplog: { acquireCount: { r: 180 } } } storage:{} protocol:op_msg 171ms
Why something try go getMore from empty rocketchat.rocketchat_livechat_inquiry collection?
Here is COMMAND statistics by hits of collections per whole day
 722017 rocketchat.rocketchat_roles
 721797 rocketchat.rocketchat_permissions
 721710 rocketchat.rocketchat_settings
 721642 rocketchat.rocketchat_integrations
 721595 rocketchat.meteor_accounts_loginServiceConfiguration
 721532 rocketchat.rocketchat_livechat_inquiry
 721182 rocketchat.rocketchat_email_inbox
 721164 rocketchat.rocketchat_livechat_department_agents
 719522 rocketchat.rocketchat_integration_history
 392532 rocketchat.instances
 184379 rocketchat.users
 108507 rocketchat.usersSessions
  92770 rocketchat.rocketchat_message
  49286 rocketchat.rocketchat_subscription
   8122 rocketchat.rocketchat_room
   5305 rocketchat.$cmd
    346 config.$cmd
    233 rocketchat._raix_push_app_tokens
     49 rocketchat.rocketchat_message_read_receipt
     18 drop
     16 rocketchat.rocketchat_avatars
     16 local.oplog.rs
      6 rocketchat.rocketchat_statistics
      4 rocketchat.rocketchat_apps_logs
      4 rocketchat.custom_emoji.files
      3 rocketchat.rocketchat_uploads
      3 rocketchat.rocketchat__trash
      3 admin.$cmd.aggregate
      2 rocketchat.rocketchat_sessions
      2 log
      1 rocketchat.ufsTokens
      1 rocketchat.rocketchat_notification_queue
      1 rocketchat.rocketchat_federation_room_events
      1 rocketchat.migrations
      1 rocketchat.custom_emoji.chunks
      1 admin.$cmd
Looks really strange!
Steps to reproduce:
- Update to 3.14.0 RocketChat version
- Check mongodb collections in COMMAND activity
Expected behavior:
Stable 24\7 work of RocketChat
Actual behavior:
We have unexpected high load on mongodb and rocket.chat servers for some reason. And that load is on strange and empty collections.
Server Setup Information:
- Version of Rocket.Chat Server: 3.14.0
- Operating System: CentOS7
- Deployment Method: docker
- Number of Running Instances: 26
- DB Replicaset Oplog: Enabled
- NodeJS Version: 12.22.1
- MongoDB Version: 4.0.24 WiredTiger
Client Setup Information
- Desktop App or Browser Version: 3.2.2 and Chrome 90
- Operating System: Windows 10
Additional context
Here is a amount of COMMAND spread by hour of the day with problem time. I can't say that it increased dramatically in a trouble time.

Relevant logs:
I don't see something strange in RC logs in that time period.