I have created a survey and want to display the free text answers in a donut chart.
When testing with 4 participants, a 'doughnut' graph was neatly displayed, but things go wrong with even more participants!
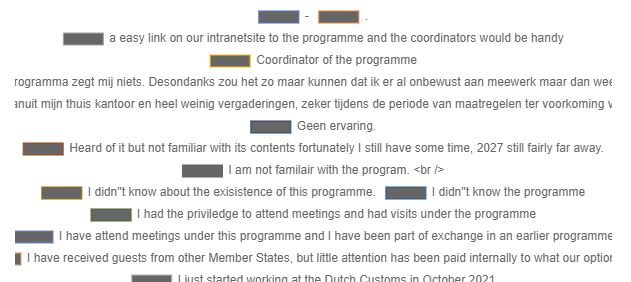
But the module does not show a graph but puts the texts one after the other. The last line is rendered corrupted!
Can i do something about this?

I have created a survey and want to display the free text answers in a donut chart.
When testing with 4 participants, a 'doughnut' graph was neatly displayed, but things go wrong with even more participants!
But the module does not show a graph but puts the texts one after the other. The last line is rendered corrupted!
Can i do something about this?