Speed up TCTrack plotting speed using LineString instead of LineCollection#611
Speed up TCTrack plotting speed using LineString instead of LineCollection#611ChrisFairless wants to merge 3 commits intodevelopfrom
Conversation
…ction

Plotting large TC event sets can take minutes or hours. This updates the
TCTracks.plot method to convert tracks to shapely LineStrings rather than
matplotlib LineCollections, which seems to speed up plotting.

The new method replaces some of the previous data wrangling and uses a
GeoDataFrame. In doing so it fixes a couple of small bugs:
- Tracks crossing 0 longitude were inadvertently identified as crossing
  180 longitude and had a gap in them
- Tracks that were identified as crossing 180 longitude effectively had
  their wind speeds shifted by one frame for all frames after the track
  crossed the meridian (due to the removal of the line segment crossing
  the meridian and LineString plotting not checking for equal vector
  lengths when matching colours to lines).

Note that:
- Tracks crossing 180 degrees still have this line segment removed. We
  could improve this: the TCTracks.to_geodataframe shows one way to do it.
- There is room for further speed improvements by combining consecutive
  line segments from a track where the category doesn't change.
- Shapely issues some deprecation warnings. I'd love help fixing these
  (I don't think they're new?)
|
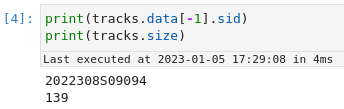
I don't understand why this is so slow for you. With your PR, your example code takes 3.4 seconds on my local notebook computer. With the current Here are some details about my setup: My IBTrACS NetCDF file dates from 2022-11-01 ( I'm running Ubuntu 22.04.1 on a notebook with Intel i7-8665U @ 1.90 GHz (4 cores) and 16 GB RAM, Intel HD graphics. I use Python 3.8.12, matplotlib 3.4.2, cartopy 0.20.2 and the output is non-interactive in a notebook running in Jupyter Lab 3.1.0. With interactive plotting ( |
Both are good points, and we should fix those. But we can easily do this in the current implementation.
Note that this will only happen if you plot global data sets. This will not apply to plots of the North Pacific because the code will automatically shift the mid longitude of the plot area. And in crowded global plots, I don't think that anybody will miss that tiny single segment at the edge of the plot area. However, we could consider an easy change: Cut off the segment at the antimeridian. In that case you have the segment at least on one side of the antimeridian. A more complicated approach would be to split the segment and assign the same wind speed to both parts. But this will be very nasty code and probably not worth the effort. |
Co-authored-by: Thomas Vogt <[email protected]>
|
It's really confusing that my plotting is so slow!! If I'm the only one experiencing the issue, maybe it's not worth an extended review here ... I can fix the two little bugs I mention I've discovered that running the code in JupyterLab instead of VSCode speeds it up by 12 minutes (time spent drawing the plot after its creation), but I'm still seeing an improvement from ~130s to ~10s.
My IBTrACS NetCDF file is from Feb 2022 (I should update it, like the warning always says), hence the smaller number of tracks. I'm running MacOS Ventura 13.1 on a notebook with Intel i7 @ 2.3 GHz (4 cores) and 16 GB RAM, Intel Iris Plus graphics. I use Python 3.8.10, matplotlib 3.4.2, cartopy 0.19.0.post1 and the output is non-interactive in a notebook running in Jupyter Lab 3.1.7. |
|
And yes, let's not make things unnecessarily complicated trying to get perfect lines crossing the antimeridian! |
|
Maybe you can try to run it with cartopy 0.20 which is now the version of cartopy listed in the CLIMADA requirements? |
|
I tried that – no difference. @mmyrte has run the above code, also on MacOS, and gets about the same timings as you do. So it looks like this is an issue with my machine. That's backed up by the fact it's currently 1 hour into solving the CLIMADA Conda environment ... 😭 So unless someone else experiences the problem, we can probably ignore this PR in its current form. |
|
Okay, I'm sorry I couldn't help you with that. I created #613 to at least fix the issues you raised above. By the way, when solving your environment is very slow, consider using |
|
Thanks, and thanks! I'll close this without merging. |
Changes proposed in this PR
Plotting large TC event sets can take minutes or hours. This updates the
TCTracks.plotmethod to convert tracks to shapelyLineStringsrather than the current matplotlibLineCollections, which seems to speed up plotting significantly.I also take the chance to improve the previous data wrangling by manipulating the data as a GeoDataFrame. In doing so it fixes a couple of small bugs:
LineString's plotting methods don't check for equal vector lengths when assigning colours to lines, for some reason).Note
TCTracks.to_geodataframeshows one way to do it.To discuss
TCTracks.to_geodataframemethod. It creates a GeoDataFrame and assigns the default CRS to it. I had to overwrite the GeoDataFrame's CRS with the CRS used in theplotmethod. Should we updateTCTracks.to_geodataframewith the CRS as a new parameter?Validation
Code to test
developagainst this branch:Running this on my machine gives an improvement from 15 minutes (was I doing something wrong???) to 17 seconds.
OLD:

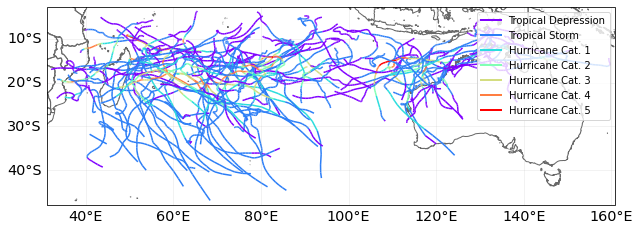
NEW:
As far as I can tell, the new method draws slightly thicker lines, but nothing else has changed.
PR Author Checklist
develop)PR Reviewer Checklist