SANDAG run time results after chunking update #444
Description
I have been testing the recent chunking update on the 1-Zone SANDAG example. The tests were run on a server with the following specs:
- Processors: 2 Intel Xeon CPU E5-2690 v4 @ 2.60Ghz
- Cores: 28 Cores, 56 Logical Processors
- Memory: 256 GB RAM
The chunk_training_mode, chunk_size, and num_processes settings were set per the documentation -- other chunking settings were left unchanged. The sequential steps taken, and their run times are recorded in the following table:
| Step | Processes | Chunk Size (RAM) | Total Run Time (minutes) |
|---|---|---|---|
| Training_1 | 45 | 205 | 1700 |
| Production | 45 | 205 | 573 |
| Production | 56 | 220 | 477 |
| Adaptive_1 | 45 | 205 | 1300 |
| Production | 56 | 220 | 499 |
| Adaptive_2 | 45 | 205 | 1112 |
| Production | 56 | 230 | 529 |
| SERVER REBOOT | |||
| Production | 56 | 230 | 362 |
| Adaptive_3 | 45 | 205 | |
| Production | 56 | 230 | 514 |
| Production | 45 | 230 | 477 |
As can be seen, the production run times fluctuate heavily and it is hard to tell which settings are best. The best run time was achieved after a server reboot but returned to prior run times after another round of adaptive. Other processor settings were used (e.g. 28) in production runs but some memory/chunking issues were encountered (specifically at this line).
Also, the run times we are getting here are much longer than the run times we were getting prior to the update. I compare the run times between a pre-update run using 56 processes and the best production run that achieved 362 minutes with 56 processes as well (both were run on the same machine):
| model_name | Pre-Update | Post-Update | Pre - Post |
|---|---|---|---|
| mandatory_tour_scheduling | 6.4 | 17.6 | -11.2 |
| joint_tour_destination | 0.9 | 5.3 | -4.4 |
| non_mandatory_tour_destination | 12.9 | 16 | -3.1 |
| non_mandatory_tour_scheduling | 2.2 | 7.8 | -5.6 |
| trip_destination | 26.8 | 65.4 | -38.6 |
| trip_scheduling | 4.8 | 142.5 | -137.7 |
| SUB MODEL RUN TIME | 92.8 | 310.9 | -218.1 |
The main differences were kept in the table above. Trip scheduling here seems to be the main bottleneck. While comparing the log files, I noticed that 100 iterations of trip scheduling were done for each run. However, the post-update run spent a lot longer for each iteration on, what seems to be, chunking processes.
Lastly, the memory usage for the post-update production run I compared above:
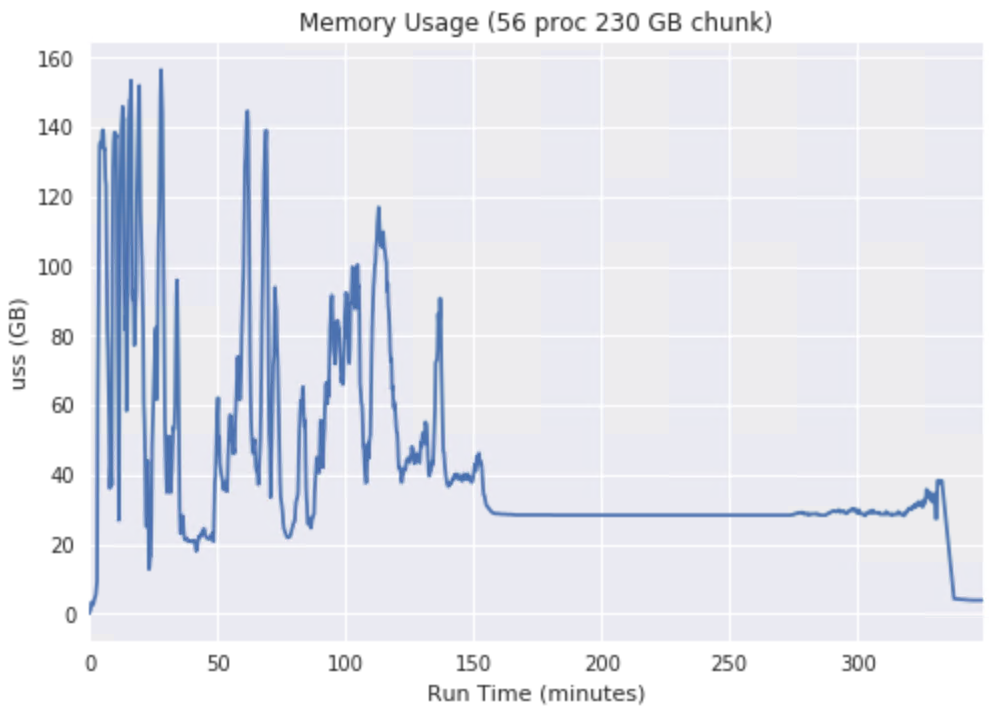
The chunk size was set to 230 GB yet it seems to peak at ~160 GB.