This week our colleagues from ETESA-IMHPA Panama reported their GNC station stopped ingesting data. After some interaction, it is working again! Here’s how we managed to discover the problem:
The receiver was on LOCK and the data LED was blinking as expected. The reception parameters were also good:
By looking at the parameters (Signal Strenght, BER, C/N, etc), we see that the reception parameters are OK and the problem should be in the workstation. For some reason, the DVB-S2 receiver was unable to communicate with the FAZZT Client, which was also configured correctly.
When this occurs, the first step is to check the firewall settings. Upon asking if there had been any recent changes to the firewall, the ETESA staff confirmed that firewall configurations had been modified. After reviewing the workstation configuration, the ingestion resumed successfully.
Please find below an important information regarding the necessary changes to our GRB stations for the transition from GOES-16 to GOES-19 as GOES-East.
This information was kindly shared by Alejandro Aguilar (LANOT/UNAM – Mexico) after reaching out to Graeme Martin from SSEC (CSPP Devs).
The following packages will need software updates to support GOES-19:
AIT Framework Gridded GLM LightningCast (minor update to address an issue with Gridded GLM overlays)
We are developing the updates and planning to release them by March 4 to give users time to update their systems before GOES-19 becomes operational on April 4.
The remaining packages already support GOES-19 and do not require updates (GRB, Geo2Grid, AXI-Tools).
As a reminder, below is the transition plan, kindly shared by NOAA during the 35th SDR Teleconference: GOES-19 is expected to be declared the operational GOES-East on April 4th, 2025. This gives us approximately one month to update our GRB stations.
Nos dias 24, 25 e 26 de setembro de 2024, a Divisão de Satélites e Sensores Meteorológicos do INPE organizou a primeira edição do Workshop Virtual de Análise e Previsão Meteorológica no Brasil no âmbito do Laboratório Virtual (VLab) da Organização Meteorológica Mundial.
Veja as gravações dos três dias do workshop nos seguintes links:
The video below shows how to overlay the NOAA LEO/GEO Flood Mapping Products on an interactive map (Brazilian Portuguese):
The following NOAA LEO/GEO Flood Mapping Products are available on GEONETCast Americas (GNC-A) rebroadcast since May 2020.
• GOES-16 & 17 ABI Hourly Composites: The ABI hourly composite has the best time manner in detecting floods as it is updated every hour under cloud free conditions. Information composited hourly for clouds to provide the best and latest cloud free information of flood extent.This can be very helpful for emergency response providing a low resolution (1-2km) initial flood extent estimate.
• Joint VIIRS / ABI flood product (daily): The joint VIIRS/ABI flood product combines the clear sky VIIRS and ABI daily composites and represents the best daily cloud-free flood extent. Available at ~0800 UTC daily and is useful for flood extent from the previous day.
• Suomi-NPP and NOAA-20 VIIRS 5-day Composite (daily): The 5-day VIIRS composite has the best spatial resolution and provides the maximal cloud-free flood extent during the latest five days. Useful for flood investigation during a major flood event.
The Flood Mapping Products on GNC-A are received on the following ingestion folders: CIMSS/Flood-ABI: GOES-16 ABI Hourly Composites Naming convention: River-Flood-ABI_YYYYMMDD_HHMNSS.part00X.force.tif Note: Parts 1 to 4 (full disk divided in 4 regions).
The quasi-nearrealtime NOAA LEO/GEO Flood Mapping Products, developed by George Mason University, produced at the University of Wisconsin Space Science and Engineering Center on a best effort basis.
Nos dias 22, 24 e 26 de abril de 2024 o INPE em parceria com a UNIFEI realizou o curso: Radar Meteorológico – Fundamentos e Processamento de Dados com Python. Contanto com 180 participantes, foram abordados diversos aspectos téoricos e práticos do processamento de dados de radar. Abaixo, as gravações dos três dias de curso.
NOAA-20 True Color composite created with Polar2Grid
Hi community,
I have created an example notebook on how to download JPSS data directly from the cloud (Google Cloud) and process the HDF5 files using SSEC Polar2Grid, also running on the cloud, using Google Colab. You can also find JPSS data in your GNC-A station, under the /CIMSS/CVIIRS folders.
You may find the examples on the following GitHub page:
AutoMET is a set of functions created to facilitate the access and visualization of satellite imagery and products, NWP data and other meteorological information using simple commands that anyone can use and adapt, including those not familiarized with programming. The examples run directly in the cloud (Google Colab), without the need of installing any tools (but it is also possible to adapt it and run the examples locally). Students may create images processing data available since the launch of each supported satellite.
Supported Datasets (Feb 2024):
Geostationary Ring (EUMETVIEW): Global mosaics (every 3 hours) with GOES-East/West, Meteosat 0°, Meteosat 45.5° and Himawari data. Data available since June 06 2021 18:00 UTC – ‘ir108’, ‘airmass’, ‘natural_color’, ‘ash’ and ‘dust’ RGBs are supported.
GOES-East and GOES-West (AWS): ‘goes16’ data available since July 10 2017, ‘goes17’ since August 28 2018, ‘goes18’ since August 02 2022. Note: please consider that goes-16 generated images every 15 minutes (instead of 10) until a few months after launch. Note: For the sake of speed, only ABI L2 Cloud and Moisture Imagery (Multi-Band Format) – Full Disks – 2 km resolution are supported for now. All 16 bands and more than 20 composites are supported.
Meteosat 0° and Meteosat 45.5° (EUMDAC): ‘msg0’ tested with data since March 26 2004 (every 15 minutes). ‘msg45’ tested with data since February 01 2017. All 12 SEVIRI bands and more than 20 composites are supported.
NWP: open ecmwf data available for download since January 21 2022 00:00 (‘2022-01-21 00:00’). gfs data available for download since February 26 2021 00:00 (‘2021-02-26 00:00’). gfs products: ‘pgrb2.0p25’, ‘pgrb2.0p50’, ‘pgrb2.1p00’. Currently, 15 fields and their variations are supported.
METAR (UNIDATA): metar data available for the last 10 days, for each hour.
LAND SAF and H SAF (EUMETSAT): A variety of products from the SAFs (Satellite Application Facilities). 14 products (LEO and GEO) from the SAFs are supported.
SENTINEL 2 (AWS): True color composites (10 m resolution) for the region of interest. Available since January 2017.
MIMIC TPW ver.2 (CIMSS): Total Precipitable Water composites for the region of interest. Available since 01 October 2016 00:00 UTC.
MetOp ASCAT Winds (NOAA Coastwatch FTP): Daily MetOP A/B/C ASCAT composites available since 07 March 2020.
Links for the latest version of the Example Google Colab Notebooks (you may create a copy and adapt them according to your needs – you may run all scripts online, there’s no need to install tools locally. Also, you may use any kind of plot in a single notebook – I have separated the examples to reduce the notebook file sizes):
Note: These examples were created primarily for use during capacity building activities but they can be adapted for operations and research as well. You may adapt the AutoMET functions the way you need!
Trainees using AutoMET functions during a capacity building event (Uruguay – November 2023):
Among the great open source packages used by AutoMET are:
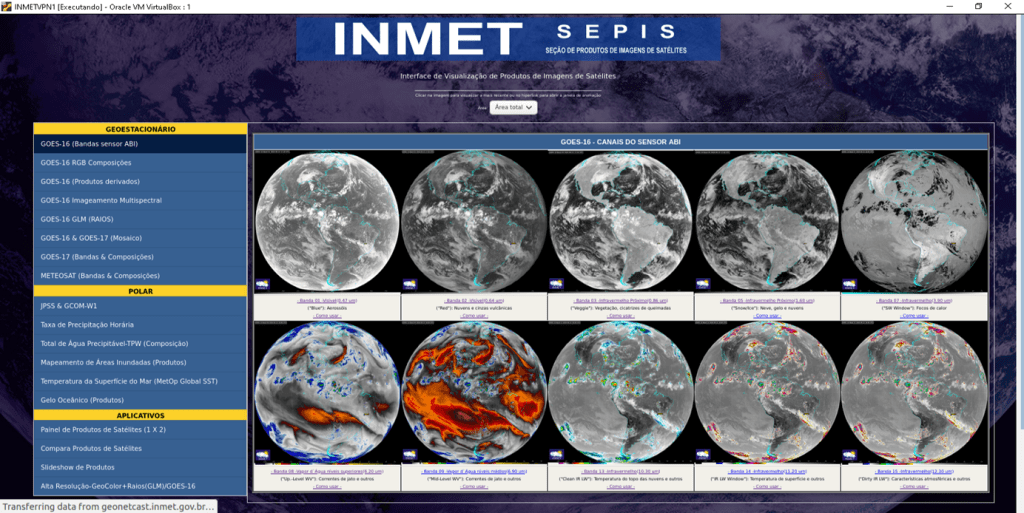
SHOWCast ia a processing and visualization tool for GEONETCast-Americas users, providing a basic HTML structure for product selection and animation, and Python scripts to convert satellite data into imagery automatically. SHOWCast can also be used with other satellite reception mechanisms like GRB, Amazon AWS and UNIDATA THREDDS. The package runs on both Windows and Linux operational systems. The primary goals for the development of SHOWCast are: Provide a free tool that can be customized (both processing and visualization) and put into operations without the need of having a BIG knowledge in programming and web development (human resources issue) and provide a free tool that can be adapted to the available hardware (technology resources issue).
Video: Introduction to SHOWCast:
Demonstration and Community Collaboration: For an online version of SHOWCast, installed, configured and adapted by MARN – El Salvador, please access the following link:
Please click at the following image to download the latest collection of links with GOES-R resources (trainer material, guides, videos and useful links):