In August this year we had the opportunity to collaborate on a 10-hour short course during the Space Week Nordeste 2023 in Brazil, including @eumetsat #MTGI1, @LSA_SAF and @HydroSAF products covering the Brazilian region (including hands-on)! 25 participants from NMHSs and universities, a great experience!
Plotting a True Color composite using MTG-I1 simulated test data and Pytroll / Satpy
This Wednesday (May 31 2023), EUMETSAT organized a short course called “Discovering MTG-I1 data using the SIFT visualisation tool”, demonstrating a multi-mission data visualisation tool called SIFT, which is suited for viewing and analysing data from MTG-I1 missions. SIFTis an open-source software released by EUMETSAT and University of Wisconsin, which utilizes the popular Satpy python-package for data reading.
Please find below the short course webpage with resources (latest release of SIFT, FCI and LI simulated test data, presentations and recording):
I was interested in testing both approaches, using SIFT and Pytroll / Satpy.
With the instructions provided during the webinar, opening the FCI simulated test data with SIFT was not difficult:
Opening the FCI IR 10.5 µm band with SSEC SIFT
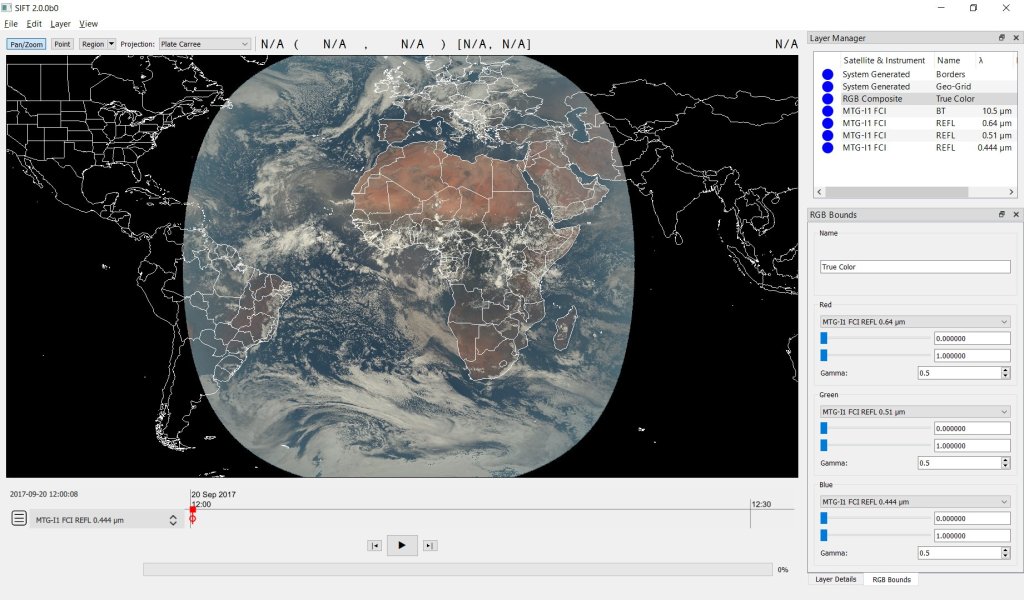
Also, creating RGB composites with SIFT is easy (only a few clicks). The image below shows a true color composite created with SIFT (using the 0.64 µm band as Red, the 0.51 µm band as Green and the 0.444 µm band as Blue – a gamma of 0.5 for R, G and B):
The second test I wanted to make is processing the FCI simulated test data using Python. On the slides provided in the short-course webpage we have some example scripts.
To run scripts locally, I have created a test conda env called “mtg_tests” and installed some libraries, including satpy:
Using the following script, creating a True Color composite with Satpy and FCI simulated test was possible:
from satpy import Scene
import glob
import os

# initialise Scene
path_to_testdata = 'C://MTG//RC0073//'
scn = Scene(filenames=glob.glob(os.path.join(path_to_testdata, '*BODY*.nc')), reader='fci_l1c_nc')

# ------ load a composite -----------------------------
scn.load(['true_color'], upper_right_corner='NE')
scn.show('true_color')
Plotting a True Color composite using MTG-I1 simulated test data and Pytroll / Satpy
I also wanted to make some tests directly in the cloud with Google Colab (which is great for capacity building activities). And that was totally possible using Condacolab and installing the necessary libraries.
Reading and plotting an FCI image using Google Colab
Below, regional plots created using Satpy and some other libraries, using Google Colab.
Regional plot using MTG-I1 FCI simulated test data
As it is with SEVIRI, the FCI imager provides a very nice coverage of the Brazilian region. With this advancements, processing MTG-I1 real data when it’s available will be easy!