Please find below presentations made by GNC-A users until May 2020:


Thank you to all GEONETCasters!

Please find below presentations made by GNC-A users until May 2020:
Thank you to all GEONETCasters!

Hi GEONETCasters!
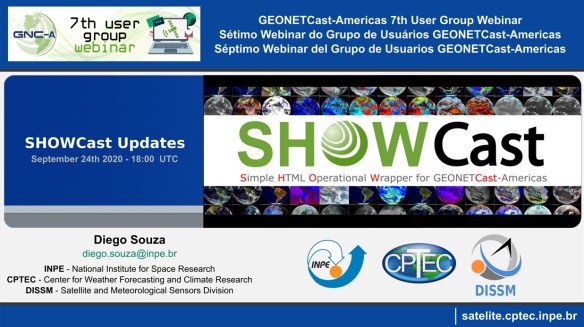
Please find below the presentations from the 7th GEONETCast-Americas User Group Webinar (click on the images to download):
NOAA UPDATES

INPE Updates
GNC-A USER CASE STUDIES
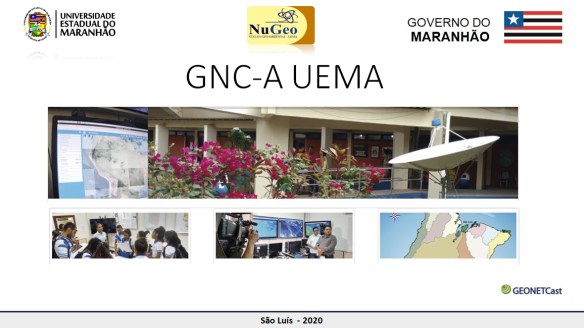
UEMA – MARANHÃO STATE UNIVERSITY – BRAZIL
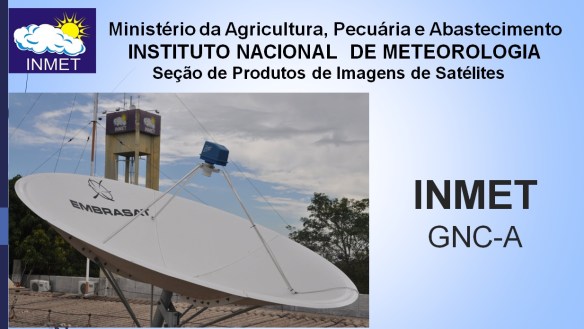
INMET – NATIONAL METEOROLOGICAL INSTITUTE – BRAZIL
Thank you to all the participants!
Please find the presentations from the other GEONETCast-Americas User Group Webinars, at the following links:
Dear Colleagues,
I hope this message finds you and your families in good health and spirits during this challenging time.
NOAA GEONETCast Americas (GNC-A) Program Manager is pleased to invite you the 7th GNC-A User Group webinar to facilitate communication among, and provide updates to GNC-A users.
The webinar will be held on Thursday, September 24, 2020, at 2PM EDT (18:00 UTC) with an anticipated duration of 1.5 hours.
Your interest and participation in these events as well as feedback on desired presentation topics for future webinars are highly valued. Please don’t hesitate to email with any questions or feedback.
GoToMeeting Link: https://global.gotomeeting.com/join/512632125
Tentative agenda:
● Welcome and Roll Call
● NOAA Updates: Increased Bandwidth, New Products
● INPE Updates: New SHOWCast Releases
● User Cases: INMET and UEMA
● Discussion Items – Ideas for the Permanent Agenda
● Action items and summary
Upcoming GNC-A User Group webinar schedule in 2020 (all dates are subject to change):
November 19
Regards,
NOAA GNC-A Program Manager

Caros Colegas,
Espero que ao ler esta mensagem você e sua família estejam com boa saúde e animados durante estes momentos difíceis.
A Gerente do Programa GNC-A da NOAA tem o prazer de convidá-lo para o sétimo seminário on-line do Grupo de Usuários GNC-A para facilitar a comunicação e fornecer atualizações para os usuários do GEONETCast Americas.
O webinar será realizado na quinta feira, 24 de setembro de 2020, às 02:00 EDT (18:00 UTC) com duração prevista de 1 hora e meia.
Link GoToMeeting: https://global.gotomeeting.com/join/512632125
Agenda provisória:
● Boas vindas e introdução dos participantes
● Atualizações da NOAA: Aumento na banda, novos produtos
● Atualizações INPE: Novas versões SHOWCast
● Exemplos e Estudos de Caso: INMET e UEMA
● Itens para discussão – Idéias para Agenda Permanente
● Itens de ação e resumo
Próximos Webinars agendados para 2020 (datas sujeitas a mudanças):
19 de novembro
Atenciosamentee,
Gerente do Programa GNC-A da NOAA

Estimados colegas,
Espero que al leer este mensaje, usted y su familia estén bien de salud y animados durante estos tiempos difíciles.
La Gerente del Programa GNC-A de la NOAA tiene el placer de invitarle al septimo seminario on-line del Grupo de Usuarios GNC-A para facilitar la comunicación y proporcionar actualizaciones a los usuarios de GEONETCast Americas..
EEl webinar se realizará el jueves, 24 de septiembre de 2020 a las 14:00 EDT (18:00 UTC) con la duración prevista de 1 hora y media.
Enlace GoToMeeting: https://global.gotomeeting.com/join/512632125
Agenda provisional:
● Bienvenida e introducción de los participantes,
● Actualizaciones de la NOAA: Aumento de la banda, nuevos productos
● Actualizaciones del INPE: Nuevas versiones SHOWCast
● Ejemplos y estúdios de caso: INMET y UEMA
● Discusión – Ideas para La agenda permanente
● Acciónes y resumen.
Próximos seminarios web programados para 2020 (fechas sujetas a cambios):
19 de noviembre
Atentamente,
Gerente del Programa GNC-A de la NOAA
Topic: JPSS VIIRS Imagery Directory Changes on GNC-A
Date/Time Issued: September 22, 2020 1400 UTC
Product(s) or Data Impacted:
Date/Time of Initial Impact: September 29, 2020 1700 UTC
Date/Time of Expected End: n/a
Length of Event: n/a
Details/Specifics of Change: On Tuesday, September 29, 2020, NOAA will remove the S-NPP VIIRS bands I5 and DNB from the JPSS/BANDS folder. The following S-NPP and NOAA-20 VIIRS bands will be added to the “CIMSS” directory sub folders:
– CIMSS/CVIIRS/IBAND: Bands I1 to I5
– CIMSS/CVIIRS/MBAND: Bands M1 to M16
– CIMSS/CVIIRS/DNB: Day Night Band
Format: CVIIRS (Compressed VIIRS)
Coverage: The data is retrieved from the following DB stations: Cuiaba BR, Cachoeira Paulista BR, Monterey CA, Madison WI and Mayaguez PR
Data Processing example: 1) Decompression:
– Download EUMETSAT CVIIRS 2 software from https://www.eumetsat.int/website/home/Data/DataDelivery/Software/
– Decompress/expand the CVIIRS files, e.g.,
chmod ugo+x $HOME/CVIIRS_2_LIN64/cviirs-2.0.2-lin64/cviirs.sh
export PATH=$HOME/CVIIRS_2_LIN64/cviirs-2.0.2-lin64:$PATH
cviirs.sh -x -M -i $PWD -o $PWD # M-bands
cviirs.sh -x -I -i $PWD -o $PWD # I-bands
cviirs.sh -x -N -i $PWD -o $PWD # DNB
2) Images – Download Polar2Grid 2.3 software from http://cimss.ssec.wisc.edu/cspp/download/index.php
– Create VIIRS images, e.g.,
export POLAR2GRID_HOME=$HOME/polar2grid_v_2_3
export PATH=$POLAR2GRID_HOME/bin:$PATH
polar2grid.sh viirs_sdr gtiff -p m15 –no-tc -f SVM15*.h5 GMODO*.h5
Contact Information for Further Information: [email protected] for information on GNC-A Program Web Site(s) for applicable information:
https://www.geonetcastamericas.noaa.gov/
https://geonetcast.wordpress.com
http://cimss.ssec.wisc.edu/
Tópico: Alterações nas bandas de imagens VIIRS
Data / Hora da Emissão: 22 de setembro de 2020 1400 UTC
Produto(s) ou Dados Impactados:
Data / Hora do Impacto Inicial: 29 de setembro de 2020 1700 UTC
Data / Hora Esperada para Término: n/a
Duração do Evento: n/a
Detalhes / Mudanças Específicas: Na 29 de setembro de 2020, a NOAA removerá as bandas VIIRS I5 e DNB do S-NPP da pasta GNC-A “JPSS / BANDS”.
As seguintes bandas S-NPP e NOAA-20 VIIRS serão adicionadas às subpastas do diretório “CIMSS”:
– CIMSS / CVIIRS / IBAND: Bandas I1 a I5
– CIMSS / CVIIRS / MBAND: Bandas M1 a M16
– CIMSS / CVIIRS / DNB: Day Night Band
Formato: CVIIRS (VIIRS compactado)
Cobertura: Os dados são obtidos das seguintes estações DB: Cuiabá BR, Cachoeira Paulista BR, Monterey CA, Madison WI e Mayaguez PR
Exemplo de processamento de dados:
1) Descompressão:
– Baixe o software EUMETSAT CVIIRS 2 em https://www.eumetsat.int/website/home/Data/DataDelivery/Software/
– Descompacte / expanda os arquivos CVIIRS, por exemplo,
chmod ugo+x $HOME/CVIIRS_2_LIN64/cviirs-2.0.2-lin64/cviirs.sh
export PATH=$HOME/CVIIRS_2_LIN64/cviirs-2.0.2-lin64:$PATH
cviirs.sh -x -M -i $PWD -o $PWD # M-bands
cviirs.sh -x -I -i $PWD -o $PWD # I-bands
cviirs.sh -x -N -i $PWD -o $PWD # DNB
2) Imagens
– Baixe o software Polar2Grid 2.3 em http://cimss.ssec.wisc.edu/cspp/download/index.php
– Crie imagens VIIRS, por exemplo,
export POLAR2GRID_HOME=$HOME/polar2grid_v_2_3
export PATH=$POLAR2GRID_HOME/bin:$PATH
polar2grid.sh viirs_sdr gtiff -p m15 –no-tc -f SVM15*.h5 GMODO*.h5
Contato para mais informações: [email protected] para informações sobre o programa GNC-A.
Web site(s) para demais informações:
https://www.geonetcastamericas.noaa.gov/
https://geonetcast.wordpress.com
http://cimss.ssec.wisc.edu/
Tema: Cambios en las bandas de imágenes de VIIRS
Fecha / hora de emisión: 22 de septiembre de 2020 1400 UTC
Producto(s) o Datos Afectados:
1) Carpeta GNC-A “JPSS / BANDS” – Imágenes VIIRS – serán eliminadas las bandas I5 y DNB
2) Carpeta GNC-A “CIMMS / CVIIRS” – Imágenes VIIRS – se agregarán todas las bandas VIIRS de los satelites S-NPP y NOAA-20
Fecha / hora del impacto inicial: 29 de septiembre de 2020 1700 UTC
Fecha / Hora de finalización prevista: n/a
Duración del evento: n/a
Detalles del cambio: En el 29 de septiembre de 2020, la NOAA eliminará las bandas VIIRS I5 y DNB del S-NPP de la carpeta GNC-A “JPSS / BANDS”.
Las siguientes bandas VIIRS S-NPP y NOAA-20 se agregarán a las subcarpetas “CIMSS”:
– CIMSS / CVIIRS / IBAND: Bandas I1 a I5
– CIMSS / CVIIRS / MBAND: Bandas M1 a M16
– CIMSS / CVIIRS / DNB: Day Night Band
Formato: CVIIRS (VIIRS comprimido)
Cobertura: Los datos se obtienen de las siguientes estaciones de DB: Cuiaba BR, Cachoeira Paulista BR, Monterey CA, Madison WI y Mayaguez PR
Ejemplo de procesamiento de datos:
1) Descompresión:
– Descargue el software EUMETSAT CVIIRS 2 desde https://www.eumetsat.int/website/home/Data/DataDelivery/Software/
– Descomprima / expanda los archivos CVIIRS, por ejemplo,
chmod ugo+x $HOME/CVIIRS_2_LIN64/cviirs-2.0.2-lin64/cviirs.sh
export PATH=$HOME/CVIIRS_2_LIN64/cviirs-2.0.2-lin64:$PATH
cviirs.sh -x -M -i $PWD -o $PWD # M-bands
cviirs.sh -x -I -i $PWD -o $PWD # I-bands
cviirs.sh -x -N -i $PWD -o $PWD # DNB
2) Imágenes
– Descargue el software Polar2Grid 2.3 desde http://cimss.ssec.wisc.edu/cspp/download/index.php
– Crear imágenes VIIRS, por ejemplo,
export POLAR2GRID_HOME=$HOME/polar2grid_v_2_3
export PATH=$POLAR2GRID_HOME/bin:$PATH
polar2grid.sh viirs_sdr gtiff -p m15 –no-tc -f SVM15*.h5 GMODO*.h5
Contacto para más información: [email protected] para información sobre el programa GNC-A
Sitio(s) web para otras informaciones:
https://www.geonetcastamericas.noaa.gov/
https://geonetcast.wordpress.com
http://cimss.ssec.wisc.edu/
Hi community!
A couple of weeks ago we have seen SHOWCasr.GR, a VERY nice SHOWCast adaptation shared by Dimitrios Papanastasiou, meteorologist from the HNMS (Hellenic National Meteorological Service). Please find below some printscreens shared by Dimitrios (click on the images to enlarge!).


This is awesome! Thanks for sharing HNMS team!

O Laboratório Virtual (VLab) da Organização Mundial de Meteorologia (OMM) é uma rede formada por Centros de Excelência (CoE) em instituições parceiras, com objetivo principal de formar meteorologistas operacionais e profissionais de áreas afins na análise e interpretação de imagens e produtos de sensoriamento remoto, a fim de contribuir com os prognósticos e monitoramento do tempo, clima e meio ambiente. A Divisão de Satélites e Sistemas Ambientais (DSA) sob a coordenação do CPTEC/INPE, é o CoE do Brasil e tem como uma de suas missões prioritárias o treinamento de usuários internos e externos, para o uso e aplicação de imagens e produtos desenvolvidos e distribuídos pela própria divisão e instituições parceiras (e.g., NASA, NOAA, ESA, EUMETSAT). Os cursos são destinados principalmente à meteorologistas operacionais e agentes de monitoramento e alerta de desastres naturais (Defesas Civis), condições de aviação (Aeronáutica), navegação (Marinha), monitoramento ambiental (IBAMA), dentre outros. Alunos de graduação e pós-graduação, bem como pesquisadores interessados também são beneficiados com os treinamentos oferecidos pelo VLab/DSA. A atuação ativa da divisão na difusão de conhecimento e capacitação de usuários, promovendo o uso das imagens e produtos de satélite nas diversas áreas de aplicação, deu à DSA uma posição de destaque, atuando há mais de 10 anos como CoE do VLab da OMM. Com a nova geração de satélites ambientais recém lançados, e.g., GOES-16 (NASA/NOAA), JPSS (NASA/NOAA), constelação Sentinel (Copernicus – ESA/EUMETSAT), com novas tecnologias que ampliam o volume de informações e aplicações, há uma grande demanda por treinamentos para ampliar o atendimento ao público alvo, em centros regionais e instituições de todo o Brasil.
Neste ano de 2020, em face aos desafios impostos pela pandemia causada pelo novo corona vírus COVID-19, o ensino à distância (EAD) se tornou mandatório, e o VLab-INPE prontamente se organizou para oferecer seminários online (webinars) e cursos que deverão ocorrer ao longo do ano. No dia 17 de julho de 2020 iniciará um ciclo de webinars sobre a nova geração de satélites meteorológicos-ambientais e os benefícios para a meteorologia e áreas afins.
O nosso próximo webinar será sobre “Produtos para monitoramento ambiental de queimadas e incêndios florestais do INPE“, na sexta feira, 25 de setembro de 2020, das 14-15:00 BRT.
Seguem abaixo os detalhes do webinar.
Webinar: Produtos para monitoramento ambiental de queimadas e incêndios florestais do INPE
Palestrante: Fabiano Morelli (INPE)
Duração: 45 minutos + 15 minutos para perguntas
Data: 25/09/2020
Horário: 14:00 h BRT
Link para acesso: https://www.gotomeet.me/cptec/vlab
Link para perguntas: https://app.sli.do/event/rssofc7y
Hi community!
It has been a long time since we started making satellite imagery plots with Python – there are hundreds of example plots on this blog.
A while ago, when searching on how to create interactive maps, I learned about Folium.
Folium is a simple, yet powerful Python wrapper for Leaflet.js, which is a leading open-source JavaScript library for plotting interactive maps. I already knew a little bit about Leaflet, because INPE / CPTEC’s A-W-E-S-O-M-E DSAT interface is built upon it.
So learning how to use Leaflet through Folium and Python would be a welcome and nice addition to our data processing / visualization options.
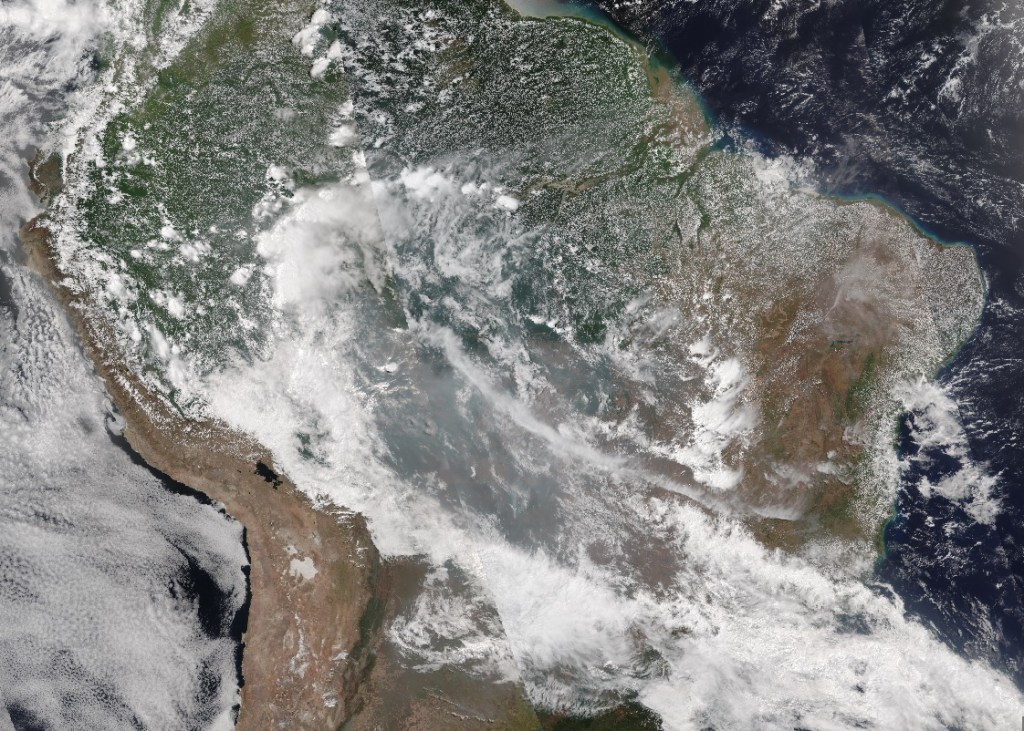
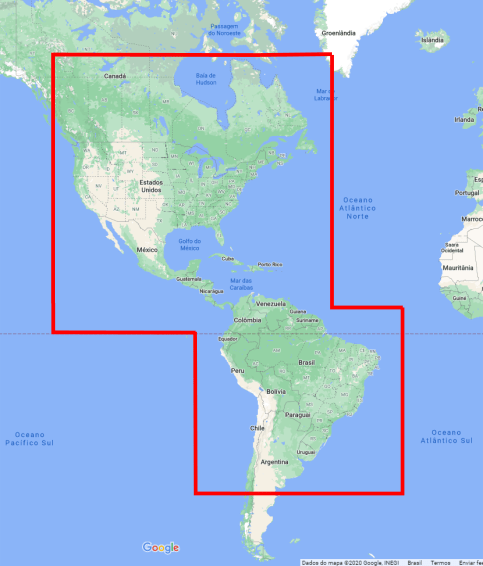
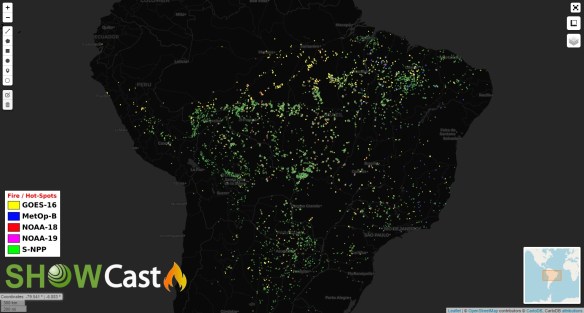
For this test, I read a shapefile found on the GNC-A folder from INPE, which contains fire / hot-spots from multiple satellites, called:
INPE_MVF_YYYYMMDDHHMN.tar.gz
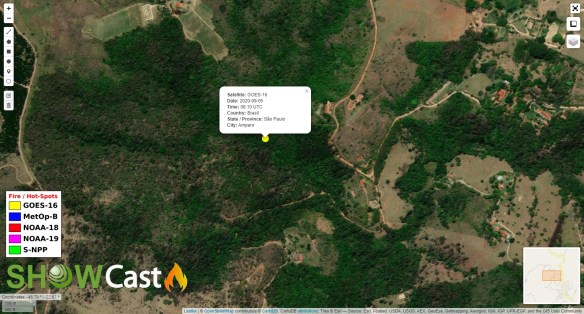
Then I read each lat / lon point on the shapefile and plot them over the map as circles (faster rendering than the default icons), representing fires. Each color represents a different satellite. When clicking at a point, some info on that point is displayed:

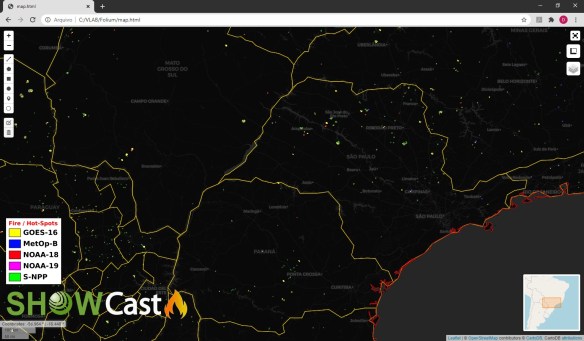
Apart from that, I added a custom logo and legend, read some additional shapefiles (countries and states) and added some Leaflet controls (drawing on the map, distance measurement, among others). All of that with some lines of code.
Very nice! This feature will be added to the next versions of SHOWCast.
Please find below an example Python script to achieve this!
######################################################################################################
# LICENSE
# Copyright (C) 2020 - INPE - NATIONAL INSTITUTE FOR SPACE RESEARCH - BRAZIL
# This program is free software: you can redistribute it and/or modify it under the terms of the GNU
# General Public License as published by the Free Software Foundation, either version 3 of the License,
# or (at your option) any later version.
# This program is distributed in the hope that it will be useful, but WITHOUT ANY WARRANTY; without
# even the implied warranty of MERCHANTABILITY or FITNESS FOR A PARTICULAR PURPOSE. See the GNU General
# Public License for more details.
# You should have received a copy of the GNU General Public License along with this program.
# If not, see http://www.gnu.org/licenses/.
#######################################################################################################
__author__ = "Diego Souza"
__email__ = "[email protected]"
__status__ = "Prototype"
# Required modules
import folium
from folium import plugins
from folium.plugins import Draw
from folium.plugins import MeasureControl
from folium.plugins import MousePosition
from folium.plugins import FloatImage
import pandas as pd
import geopandas as gpd
from shapely.geometry import Point
#================================================================================
# Create the map
m = folium.Map(
location=[-15, -58],
zoom_start=5,
tiles='cartodbdark_matter',
crs='EPSG3857',
control_scale=True,
prefer_canvas=True
)
# Add the full screen button
plugins.Fullscreen(
position='topright',
title='Expand me',
title_cancel='Exit me',
force_separate_button=True
).add_to(m)
# Add the mouse position coordinates
formatter = "function(num) {return L.Util.formatNum(num, 3) + ' ยบ ';};"
MousePosition(
position='bottomleft',
separator=' | ',
empty_string='NaN',
lng_first=True,
num_digits=20,
prefix='Coordinates:',
lat_formatter=formatter,
lng_formatter=formatter,
).add_to(m)
# Add a mini map
minimap = plugins.MiniMap()
m.add_child(minimap)
# Add drawinf controls
draw = Draw()
draw.add_to(m)
m.add_child(MeasureControl())
# Add the lat lon pop up when clicking
m.add_child(folium.LatLngPopup())
#================================================================================
# Add custom logos and legends
image = ('showcast_fire.png')
FloatImage(image, bottom=7, left=1).add_to(m)
image = ('showcast_fire_legend.png')
FloatImage(image, bottom=18, left=1).add_to(m)
#================================================================================
# Add shapefiles
shape = ('ne_50m_admin_0_countries.shp')
countries = gpd.read_file(shape)
shape = ('ne_10m_admin_1_states_provinces.shp')
states = gpd.read_file(shape)
shape = ('ne_10m_coastline.shp')
coastlines = gpd.read_file(shape)
geoPath_countries = countries.geometry.to_json()
geoPath_states = states.geometry.to_json()
geoPath_coastlines = coastlines.geometry.to_json()
folium.GeoJson(
geoPath_states,
name='States',
show=False,
style_function=lambda feature: {
'fillColor': '#00000000',
'color': 'gold',
'weight': 1.0,
}
).add_to(m)
folium.GeoJson(
geoPath_countries,
name='Countries',
show=False,
style_function=lambda feature: {
'fillColor': '#00000000',
'color': 'black',
'weight': 1.0,
}
).add_to(m)
folium.GeoJson(
geoPath_coastlines,
name='Coastlnes',
show=False,
style_function=lambda feature: {
'fillColor': '#00000000',
'color': 'red',
'weight': 1.0,
}
).add_to(m)
#================================================================================
# Read the Fire / Hot Spot Shapefile and plot it as points over the map
inpe_mvf = gpd.read_file('INPE_MVF_202009050000.shp')
geometry = [Point(xy) for xy in zip(inpe_mvf['longitude'], inpe_mvf['latitude'])]
df = gpd.GeoDataFrame(inpe_mvf, geometry = geometry)
fires = folium.map.FeatureGroup()
latitudes = list(df.latitude)
longitudes = list(df.longitude)
labels = list(df.cod_sat)
dates = list(df.data_pas)
times = list(df.id_pas)
countries = list(df.name_0)
states = list(df.name_1)
cities = list(df.name_2)
for lat, lng, label, date, time, country, state, city in zip(latitudes, longitudes, labels, dates, times, countries, states, cities):
if label == 'GOES-16':
popup_text = "<b>Satellite:</b> " + label + '<br>' + '<b>Date:</b> ' + date + '<br>' + '<b>Time:</b> ' + time[-11:-9] + ':' + time[-9:-7] + ' UTC' + '<br>' + '<b>Country:</b> ' + country + '<br>' + '<b>State / Province:</b> ' + state + '<br>' + '<b>City:</b> ' + city
folium.Circle(
[lat, lng],
radius=10,
fill=True,
#line_color='white',
color='white',
fill_color='yellow',
weight = 0.2,
fill_opacity=1,
).add_child(folium.Popup(popup_text, max_width=200,min_width=200)).add_to(m)
for lat, lng, label, date, time, country, state, city in zip(latitudes, longitudes, labels, dates, times, countries, states, cities):
if label == 'METOP-B':
popup_text = "<b>Satellite:</b> " + label + '<br>' + '<b>Date:</b> ' + date + '<br>' + '<b>Country:</b> ' + country + '<br>' + '<b>State / Province:</b> ' + state + '<br>' + '<b>City:</b> ' + city#+ '<br>' + '<b>Time:</b> ' + time[-11:-9] + ':' + time[-9:-7] + ' UTC'
folium.Circle(
[lat, lng],
radius=10,
fill=True,
#line_color='white',
color='white',
fill_color='blue',
weight = 0.2,
fill_opacity=1,
).add_child(folium.Popup(popup_text, max_width=200,min_width=200)).add_to(m)
for lat, lng, label, date, time, country, state, city in zip(latitudes, longitudes, labels, dates, times, countries, states, cities):
if label == 'NOAA-18':
popup_text = "<b>Satellite:</b> " + label + '<br>' + '<b>Date:</b> ' + date + '<br>' + '<b>Country:</b> ' + country + '<br>' + '<b>State / Province:</b> ' + state + '<br>' + '<b>City:</b> ' + city#+ '<br>' + '<b>Time:</b> ' + time[-11:-9] + ':' + time[-9:-7] + ' UTC'
folium.Circle(
[lat, lng],
radius=10,
fill=True,
#line_color='white',
color='white',
fill_color='red',
weight = 0.2,
fill_opacity=1,
).add_child(folium.Popup(popup_text, max_width=200,min_width=200)).add_to(m)
for lat, lng, label, date, time, country, state, city in zip(latitudes, longitudes, labels, dates, times, countries, states, cities):
if label == 'NOAA-19':
popup_text = "<b>Satellite:</b> " + label + '<br>' + '<b>Date:</b> ' + date + '<br>' + '<b>Country:</b> ' + country + '<br>' + '<b>State / Province:</b> ' + state + '<br>' + '<b>City:</b> ' + city#+ '<br>' + '<b>Time:</b> ' + time[-11:-9] + ':' + time[-9:-7] + ' UTC'
folium.Circle(
[lat, lng],
radius=10,
fill=True,
#line_color='white',
color='white',
fill_color='purple',
weight = 0.2,
fill_opacity=1,
).add_child(folium.Popup(popup_text, max_width=200,min_width=200)).add_to(m)
for lat, lng, label, date, time, country, state, city in zip(latitudes, longitudes, labels, dates, times, countries, states, cities):
if label == 'NPP':
popup_text = "<b>Satellite:</b> " + label + '<br>' + '<b>Date:</b> ' + date + '<br>' + '<b>Country:</b> ' + country + '<br>' + '<b>State / Province:</b> ' + state + '<br>' + '<b>City:</b> ' + city#+ '<br>' + '<b>Time:</b> ' + time[-11:-9] + ':' + time[-9:-7] + ' UTC'
folium.Circle(
[lat, lng],
radius=10,
fill=True,
#line_color='white',
color='white',
fill_color='green',
weight = 0.2,
fill_opacity=1,
).add_child(folium.Popup(popup_text, max_width=200,min_width=200)).add_to(m)
#================================================================================
# Add the background tile options
folium.TileLayer(
name="Esri World Imagery",
tiles='https://server.arcgisonline.com/ArcGIS/rest/services/World_Imagery/MapServer/tile/{z}/{y}/{x}',
attr='Tiles © Esri — Source: Esri, i-cubed, USDA, USGS, AEX, GeoEye, Getmapping, Aerogrid, IGN, IGP, UPR-EGP, and the GIS User Community',
).add_to(m)
folium.TileLayer('openstreetmap').add_to(m)
folium.TileLayer('Stamen Terrain').add_to(m)
folium.TileLayer('Stamen Toner').add_to(m)
folium.TileLayer('Stamen Water Color').add_to(m)
folium.TileLayer('cartodbpositron').add_to(m)
folium.TileLayer('cartodbdark_matter').add_to(m)
folium.LayerControl().add_to(m)
# Save the map as an HTML file
m.save('map.html')
Really, python can do anything. Stay tuned for news!
Demilson Quintão (PY2UEP), a GNC-A user from Brazil, kindly shared the following video with detailed info on solar interference in satellites (Portuguese):
Entenda: por que o Sol interfere em satélites? Por que apenas em determinados dias? Veja as interferências que o Sol pode ocasionar nos sinais dos satélites, acompanhadas ao vivo e veja um radiotelescópio em funcionamento!
https://www.portaleds.com/satelites
https://www.satlex.net/
Softwares:
Thanks for sharing Demilson!
Dear Colleagues,
I hope this message finds you and your families in good health and spirits during this challenging time.
NOAA GEONETCast Americas (GNC-A) Program Manager is pleased to invite you the 7th GNC-A User Group webinar to facilitate communication among, and provide updates to GNC-A users.
The webinar will be held on Thursday, September 24, 2020, at 2PM EDT (18:00 UTC) with an anticipated duration of 1.5 hours.
Your interest and participation in these events as well as feedback on desired presentation topics for future webinars are highly valued. Please don’t hesitate to email with any questions or feedback.
Tentative agenda:
● Welcome and Roll Call
● NOAA Updates: Increased Bandwidth, New Products
● INPE Updates: New SHOWCast Releases
● User Cases: INMET and UEMA
● Discussion Items – Ideas for the Permanent Agenda
● Action items and summary
Upcoming GNC-A User Group webinar schedule in 2020 (all dates are subject to change):
November 19
Regards,
NOAA GNC-A Program Manager
Caros Colegas,
Espero que ao ler esta mensagem você e sua família estejam com boa saúde e animados durante estes momentos difíceis.
A Gerente do Programa GNC-A da NOAA tem o prazer de convidá-lo para o sétimo seminário on-line do Grupo de Usuários GNC-A para facilitar a comunicação e fornecer atualizações para os usuários do GEONETCast Americas.
O webinar será realizado na quinta feira, 24 de setembro de 2020, às 02:00 EDT (18:00 UTC) com duração prevista de 1 hora e meia.
Agenda provisória:
● Boas vindas e introdução dos participantes
● Atualizações da NOAA: Aumento na banda, novos produtos
● Atualizações INPE: Novas versões SHOWCast
● Exemplos e Estudos de Caso: INMET e UEMA
● Itens para discussão – Idéias para Agenda Permanente
● Itens de ação e resumo
Próximos Webinars agendados para 2020 (datas sujeitas a mudanças):
19 de novembro
Atenciosamentee,
Gerente do Programa GNC-A da NOAA
Estimados colegas,
Espero que al leer este mensaje, usted y su familia estén bien de salud y animados durante estos tiempos difíciles.
La Gerente del Programa GNC-A de la NOAA tiene el placer de invitarle al septimo seminario on-line del Grupo de Usuarios GNC-A para facilitar la comunicación y proporcionar actualizaciones a los usuarios de GEONETCast Americas..
EEl webinar se realizará el jueves, 24 de septiembre de 2020 a las 14:00 EDT (18:00 UTC) con la duración prevista de 1 hora y media.
Agenda provisional:
● Bienvenida e introducción de los participantes,
● Actualizaciones de la NOAA: Aumento de la banda, nuevos productos
● Actualizaciones del INPE: Nuevas versiones SHOWCast
● Ejemplos y estúdios de caso: INMET y UEMA
● Discusión – Ideas para La agenda permanente
● Acciónes y resumen.
Próximos seminarios web programados para 2020 (fechas sujetas a cambios):
19 de noviembre
Atentamente,
Gerente del Programa GNC-A de la NOAA
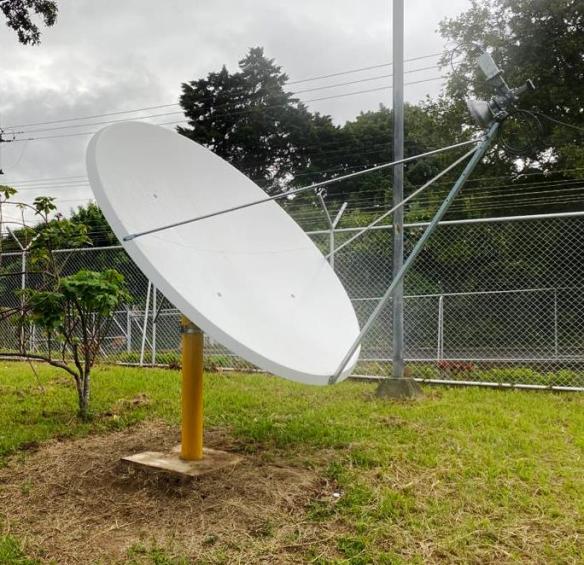
Hi GEONETCasters,
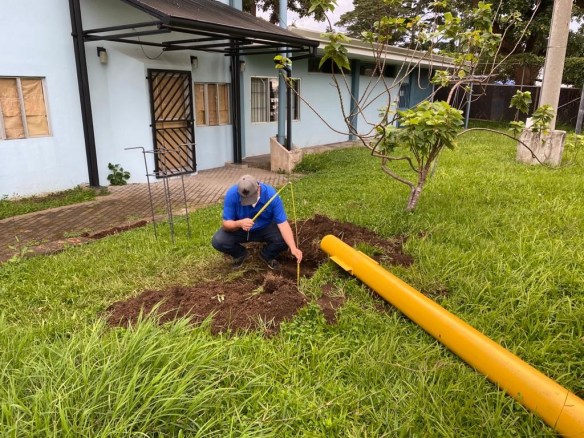
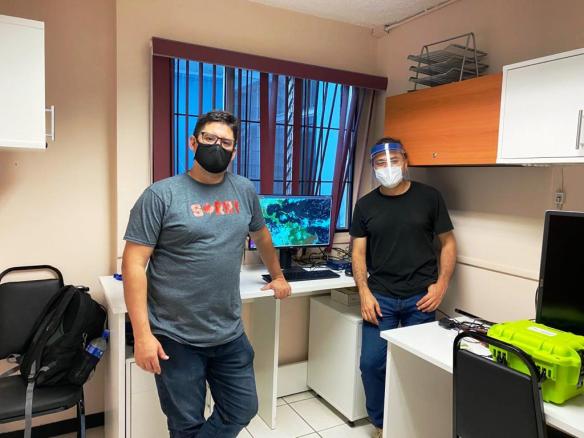
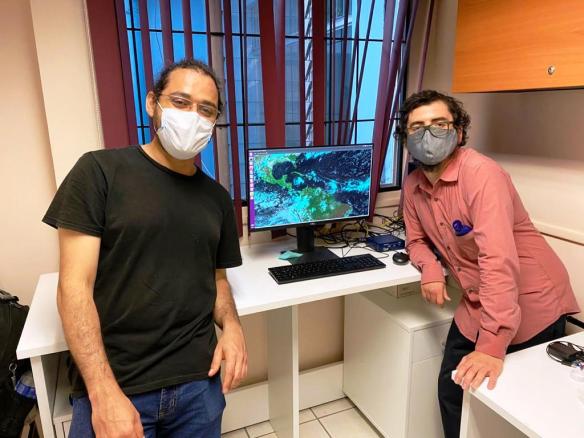
Marcial Garbanzo , from UCR, the University of Costa Rica, kindly shared some photos of their GEONETCast-Americas station.
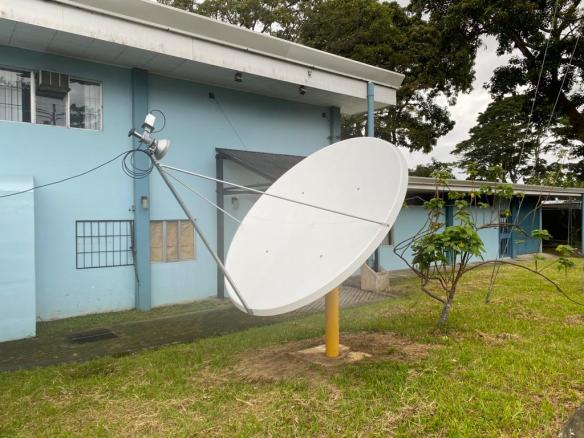
Marcial and his team did all the steps required to get the station working, including digging the hole, pouring concrete, putting the antenna together, pointing the dish and installing OS and software. Great experience!
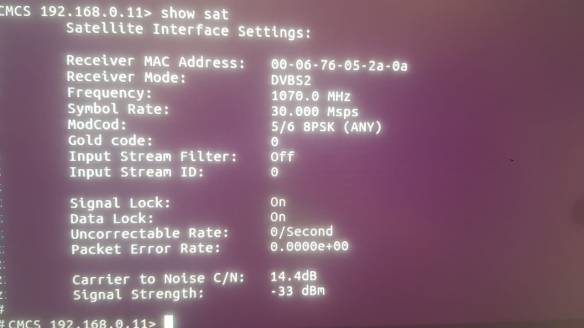
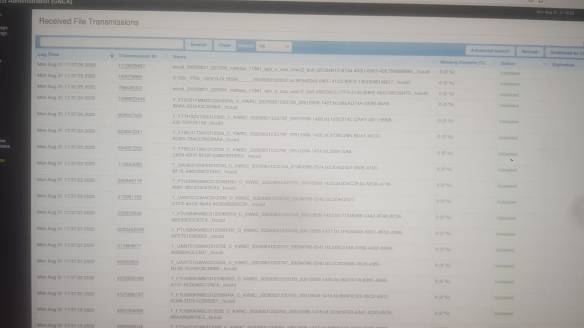
The images below shows the NOVRA receiver software showing the reception status and the FAZZT Client showing some received files.
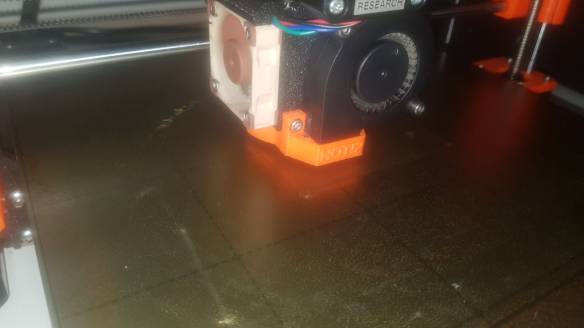
They even printed a plate to be attached to the feedhorn and seal it. Can something be cooler than this?
Thanks for sharing Marcial and UCR!
Do you have a newly installed GNC-A instation that hasn’t been shown in the Blog? Please send us a photo to [email protected].
“New Operational GNC-A Station” Series:
