GEONETCast-Americas Imagery of The Day [7]: Snow and Ice!

GCOMIceSnow_25112018a.png

GCOM-W1 AMSR-2 Sea Ice + Snow Cover + Snow Depth Products overlayed – November 26th, 2018

GCOM-W1_Snow_26112018a.png

GCOM-W1 AMSR-2 Snow Cover Product – November 26th, 2018

Hi GEONETCasters! In the seventh entry in the series, some snow and ice products from GCOM-W1 AMSR-2!

GCOM-W1_Snow_26112018b.png

GCOM-W1 AMSR-2 Snow Cover  and Snow Depth Products overlayerd – November 26th, 2018

GCOM-W1_Snow_26112018c.png

GCOM-W1 AMSR-2 Snow Cover  and Snow Depath Products overlayerd – November 26th, 2018

The Snow Cover, Snow Depth, Snow Water equivalent products NetCDF’s are received in the JPSS/PRODUCTS/G-SNOW GEONETCast-Americas folder. The Sea Ice products NetCDF’s are received in the JPSS/PRODUCTS/G-SEAICE GEONETCast-Americas folder.

New JPSS Products 04192018

GCOM-W1_Ice_25112018b.png

The NetCDF’s were converted to GeoTIFF with Python and visualized with SIGMACast (Python and SIGMACast integration in progress!).

Please find below the other posts from this Blog series:

JPSS

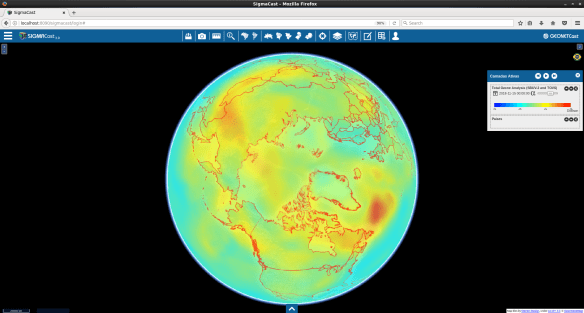
GEONETCast-Americas Imagery of The Day [6]: Total Ozone Analysis using SBUV/2 and TOVS

GNC-A Ozone Analysis A.png

Total Ozone Analysis using SBUV/2 and TOVS (November 15, 2018)

Hi GEONETCasters! In the sixth entry in the series, the daily Total Ozone Analysis using SBUV/2 and TOVS.

GNC-A Ozone Analysis B.png

From the official Webpage:

NOAA produces daily ozone products from Solar Backscatter UltraViolet Version 2 (SBUV/2) and Advanced Tiros-N Operational Vertical Sounder (TOVS).

Total and profile ozone from the SBUV/2 instrument are retrieved from radiance measurements at 12 discrete wavelengths in the ultraviolet (252 to 340 nm) (Bhartia et al., J. of Geophys. Res., 1996). The SBUV/2 data has gaps between its 14 orbits and over the pole during polar night because it is a nadir-viewing instrument. Ozone maps are generated using Cressman interpolation scheme. This interpolation scheme works well but spatial smoothing can mask small-scale features and miss extremes.

The TOVS data are retrieved using radiance measurements made by the High Resolution InfraRed Sounder (HIRS) at 9.7 microns. This retrieval technique is sensitive only to ozone changes between 4 to 23 km. Latitude dependent but seasonally independent climatology is used in the mid-to-upper stratosphere to derive total ozone (Neuendorffer, J. of Geophys. Res., 1996). TOVS maps are at high spatial resolution because of its twice daily measurements (day and night) and because it is a scanning instrument. Unlike the ultraviolet based instruments TOVS can measure in the polar night. However, accuracy of its total ozone estimate is compromised when ozone changes occur in the mid-to-upper stratosphere.

TOAST is a total column ozone map generated by combining TOVS tropospheric and lower stratospheric (4 to 23 km) ozone retrievals with SBUV/2 spatially smoothed mid-to-upper stratospheric (24 to 54 km) layer ozone retrievals. In essence, we are replacing TOVS climatology with real-time SBUV/2 measurements in the mid-to-upper stratosphere.

GNC-A Ozone Analysis C.png

GEONETCast-Americas Users may find these Global GRIB2 files the NOAA-NESDIS GNC-A folder.

The GRIB2 files were converted to GeoTIFF with Python and visualized with SIGMACast (Python and SIGMACast integration in progress!).

Please find below the other posts from this Blog series:

GEONETCast-Americas Imagery of The Day [5]: GOES-16 + GFS Model

G16_GFS5.png

GOES-16 Band 13 + Temperature at 850 hPa GFS Analysis (November 14th, 2018, 12 UTC)

G16_GFS1.png

GOES-16 Band 13 + Pressure at Mean Sea Level GFS Analysis (November 14th, 2018, 12 UTC)

Hi GEONETCasters! In the fifth entry in the series, the GOES-16 Band 13 with some GFS analysis overlayed.

G16_GFS2.png

G16_GFS6.png

G16_GFS3.png

GOES-16 Band 13 + Geopotential Height at 500 hPa (November 14th, 2018, 12 UTC)

Users may find Global GFS GRIB2 files (1 degree) at the ISCS-GRIB2 GNC-A folder and Regional GFS GRIB2 files (0.5 degree), for South and Central Americas, at the Marn-ElSalvador GNC-A folder.

iscs-grib2-marn-folder.png

The NetCDF’s were converted to GeoTIFF with Python and visualized with SIGMACast (Python and SIGMACast integration in progress!).

Please find below the other posts from this Blog series:

GEONETCast-Americas Imagery of The Day [4]: Hourly Global Blended TPW and TPW Anomaly

BTPW3.png

Blended Total Precipitable Water product (November 12th, 2018, 10:31 UTC)

Hi GEONETCasters! In the fourth entry in the series, the Global Blended TPW and TPW Anomaly Products received hourly through GNC-A.

“The blended TPW products, developed at CIRA with forecasters in mind, merges the TPW retrievals from various satellites/sensors/algorithms, currently including NOAA-18&-19, Metop-A&-B, S-NPP, GCOM-W1 and GPM, and also GOES-W, Met-GPS, to provide a unified global TPW map in supporting of the NWS users’ need.” (link)

BTPW2.png

Blended TPW with GOES-16 channel 13 overlayed

BTPW6.png

BTPW1

BTPWA1.png

Percentage of TPW normal, or TPW anomaly product (November 12th, 2018, 10:31 UTC)

The Blended TPW and TPW anomaly NetCDF’s are received in the JPSS/PRODUCTS/BTPW GEONETCast-Americas folder.

New JPSS Products 04192018

The NetCDF’s were converted to GeoTIFF with Python and visualized with SIGMACast (Python and SIGMACast integration in progress!).

Please find below the other posts from this Blog series:

JPSS

GEONETCast-Americas Imagery of The Day [3]: GOES-16 Band 13 + GCOM-W1 Rain Rate

CH13_RR3

Hi GEONETCasters! In the third entry in the series, the GOES-16 ABI channel 13 (November 9th, 2018, 12:15 UTC) with the  GCOM-W1 Rain Rate Product overlayed (orbits form the same day).

CH13_RR2.png

The “PRECIPITATION” NetCDF’s from GCOM-W1 orbits are received in the JPSS/PRODUCTS/G-PRECIPITATION GEONETCast-Americas folder.

New JPSS Products 04192018

he NetCDF’s were converted to GeoTIFF with Python and visualized with SIGMACast (Python and SIGMACast integration in progress!).

Please find below the other posts from this Blog series:

JPSS

GEONETCast-Americas Imagery of The Day [2]: GCOM-W1 AMSR-2 Sea Surface Temperature

GCOM-W1 SST 11062018 B.png

Hi GEONETCasters! In the second entry in the series, the Sea Surface Temperature aquired by the AMSR-2 instrument aboard the GCOM-W1 satellite (orbits from November 6th 2018).

GCOM-W1 SST 11062018 A.png

The SST NetCDF’s from GCOM-W1 orbits are received in the JPSS/PRODUCTS/G-OCEAN GEONETCast-Americas folder.

New JPSS Products 04192018

The NetCDF’s were converted to GeoTIFF with Python and visualized with SIGMACast (Python and SIGMACast integration in progress!).

Please find below the other posts from this Blog series:

JPSS