

UNALM, the National Agrarian University from La Molina, Peru, one of the GEONETCast-Americas users, kindly shared with us how they are manipulating the GOES-16 NetCDF’s received through GNC-A with the “R” Programming Language with their students.

You may see their progress in this Blog post.
Let’s see how to do it, step by step.
1 – Download and Installation
Download the R Programming Language interface at the following link and install it according to your system:
https://cloud.r-project.org/
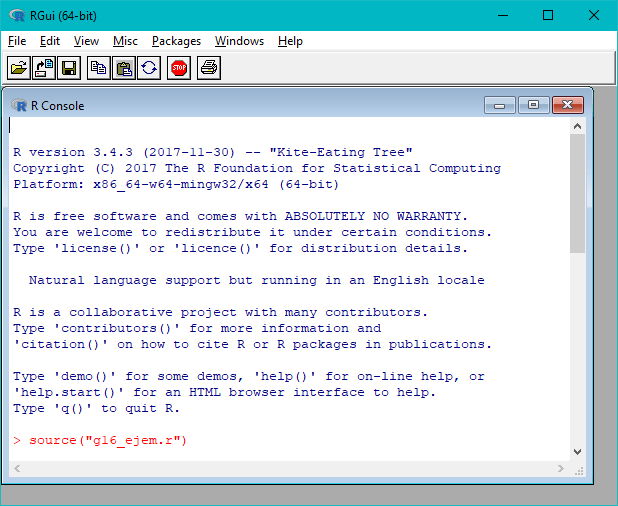
Execute the “RGui” interface. The image below shows the “RGui” main window and the “R Console” (where you insert commands, after the “>” symbol), that should be opened automatically:

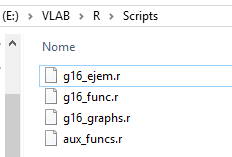
2 – Download the example scripts from UNALM
Download the R scripts provided by UNAL at this link. Unzip the “R Tutorial – UNALM.zip” at the folder of your preference. For your reference, we put the scripts at “E:/VLAB/R/Scripts”. This is what you should have:
Back to the “RGui”, indicate the scripting folder you just created at “File” > “Change dir…”. This will allow you to refer your scripts in your code without having to include the full directory path.

3 – Download a Shapefile for countries
For this example, you should have a shapefile for countries. In our example, we downloaded the countries shapefile from this link (click on “Download”). In our example, we unziped the “ne_10m_admin_0_countries.zip” at “E:/VLAB/R/Shapefiles”. This is how it is seen in our computer:

4 – Download some GOES-16 NetCDF’s samples for this tutorial
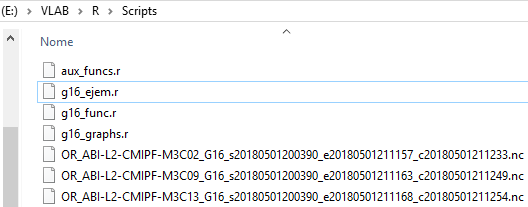
You may use the GOES-16 Full-Disk NetCDF’s received from GEONETCast-Americas or from other mechanisms. For this example, we’ll use some samples downloaded from Amazon, from February 19th, 2018, 12:00 UTC. Please find below the download links:
In this example, we put these samples on the same folder we have our scripts, at “E:/VLAB/R/Scripts”.
5 – Install the required libraries to manipulate the GOES-16 NetCDF’s
In order to run the provided scripts, you should install the following “R” libraries:
- ncdf4
- RColorBrewer
- fields
- maps
- gdalUtils
- rgdal
To install these libraries, in the “RGui”, you should insert the command:
install.packages(“name of the library“)
So, you should insert the commands below, clicking enter after each command, and choosing one of the CRAN mirros, as seen at the picture below:
install.packages("ncdf4")
install.packages("RColorBrewer")
install.packages("fields")
install.packages("maps")
install.packages("gdalUtils")
install.packages("rgdal")

6 – Download and install GDAL, open the “g16_func.r”, and at line 45, choose your GDAL installation directory
To open a script on the RGui, choose “File” > “Open script…” and choose the script of interest. To save it, choose “File” > “Save” or “Ctrl+S”. Note: You may change the scripts with any text editor you want:

In our case, we’ll open the “g16_func.r”:

As we did in Python, the “R” scripts use GDAL to reproject GOES-16 data. You should install GDAL and refer the installation directory in the “g16_func.r”, at line 45.

There are multiple ways to install GDAL and configure it. One of the easiest ways is to install “QGIS” and refer to the directory:
gdal_setInstallation(search_path = ‘C:/Program Files/QGIS 2.18/bin’)
Or, you may download the GDAL installer at this link, and a bat file to configure the environmental variables at this link.
Also, you may see a Blog tutorial on how to install GDAL at this link (pages 89 to 96).
7 – Open the “g16_ejem.r” script and change the input file, the output subsect file, the region to subsect and the shapefile to read
Open the “g16_ejem.r” and the change the following according to your needs:
- Line 38: The input GOES-16 NetCDF file
- Line 39: The output subsected file (it is recommended to keep a similar name, because some information is extracted from the file name)

- Line 40 and Lines 56 to 59: Region to subsect. The original region in the script is set for Peru

- Line 72: Shapefile to read, in dsn put the path, in layer, the name of the shapefile.
- Line 76: Name of the resulting file

8 – Execute the script “g16_ejem.r”
To execute a script at the “RGui”, insert the following command at the “R Console”:
source(“name of the script.r“)
So, to execute the “g16_ejem.r” script, insert the following command and click enter:
source("g16_ejem.r")
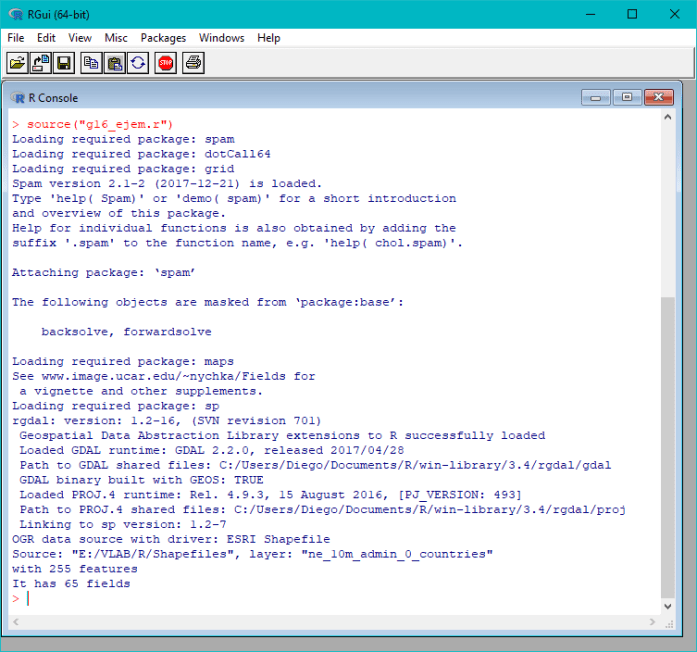
If everything goes well, this should be the output:
You should see the “Band13.png” image created at your scripting folder.


You may change the input file at lines 38, 39 and the file output name at line 76 and plot other bands:


Thanks for your contribution UNALM!
Check out the other tutorials from this blog at this link.
