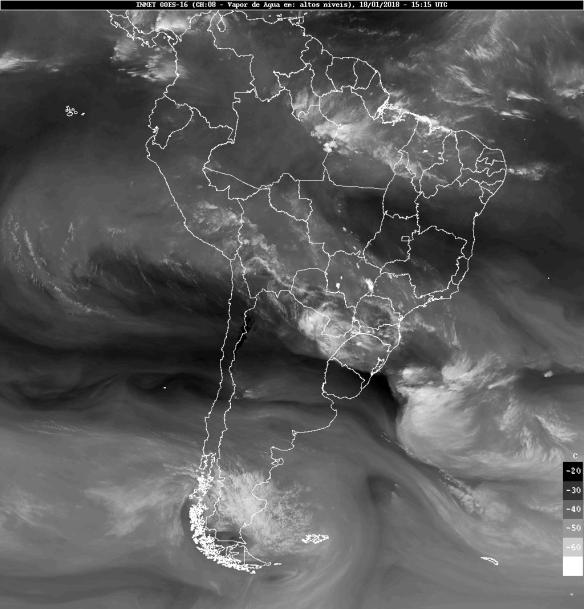
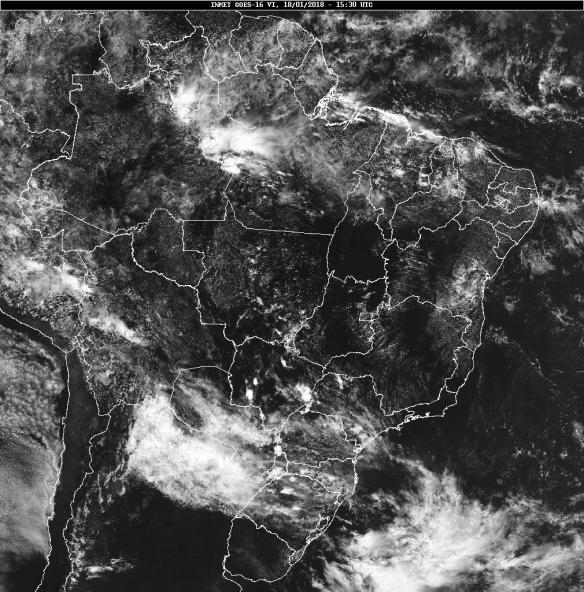
Diego, from the ClimaSurGBA webpage (Quilmes, Argentina), is creating very nice plots for the ABI channels 13 and 02 using data downloaded from Amazon S3. High resolution images from his webpage for channel 13 here and for channel 02 here. Diego followed the Python Tutorial Series, changing the image projection. You may see a script to download GOES-16 NetCDF’s from Amazon on this Blog post.


This Blog series shows the products developed by the community in the Americas. Most of them refers to data received from GNC-A, however, we also post the development with data received from other means (Amazon S3, FTP, etc). Please find below the other posts from this series:

- Part I: Plots from the first day of CMI data in GNC-A
- Part II: Plots from MARN, INPE, UFLA, IDEAM and FUNCEME
- Part III: Plots from IPMET, MARN and IDEAM
- Part IV: Plots from UCR, IPMET and INSMET
- Part V: Plot from INSMET/CIMO (Hurricane IRMA)
- Part VI: Plots from the Brazilian Navy (Sea Ice from EUMETSAT)
- Part VII: Plots from the Meteorological Service of Chile and MARN
- Part VIII: Plots from SENAMHI Peru
- Part IX: Plots from CLIMATEMPO
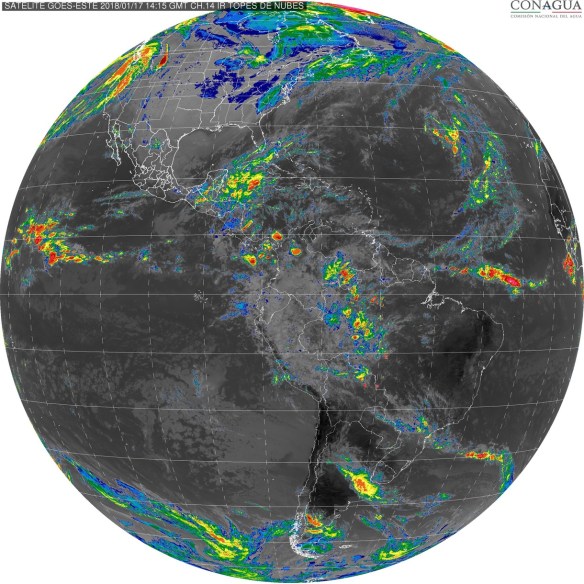
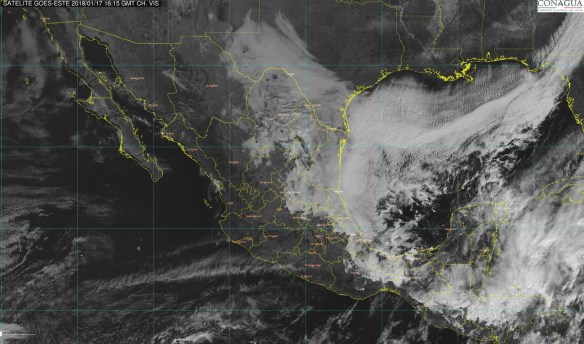
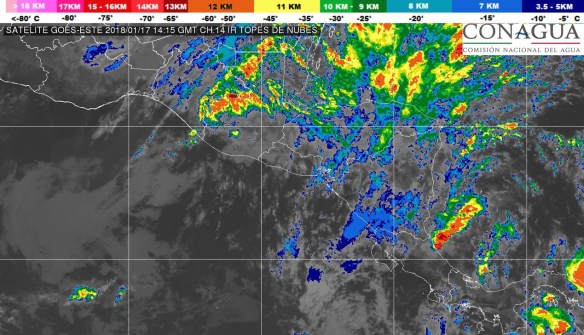
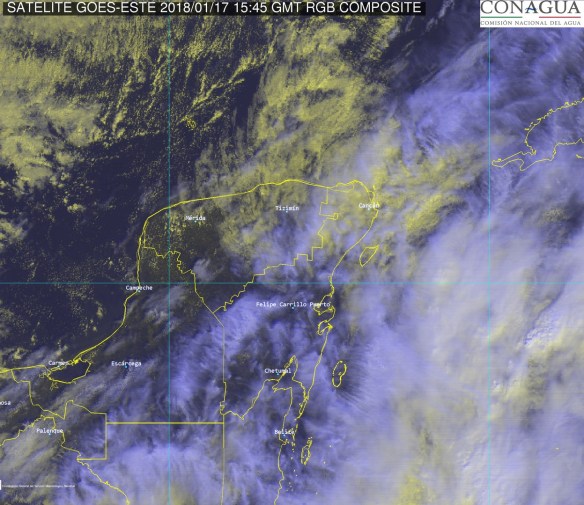
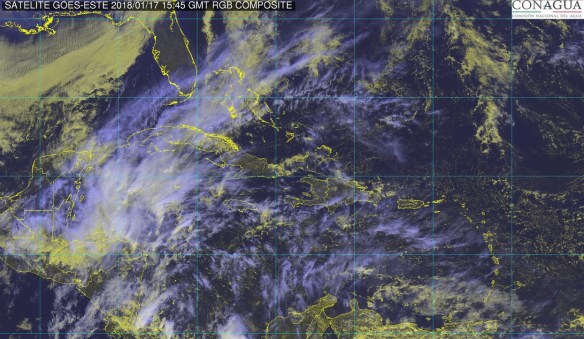
- Part X: Plots from CONAGUA
- Part XI: Plots from INMET