-
YouTube Analysis Graph

Inspiration
YouTube's recommended algorithm is unknown and complex. However, it dictates a majority of viewing content for billions of users, which greatly affects the media we consume.
What it does
Our project gathers data about YouTube videos:
- Title
- Duration
- Date Published
- Category
- Creator
- Recommended Videos
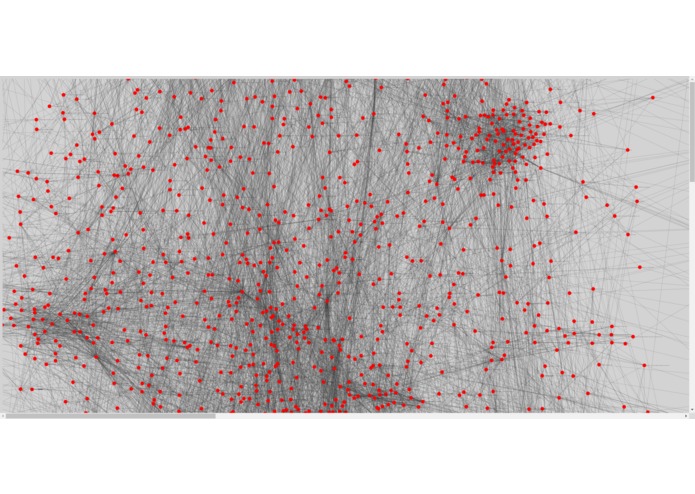
Then, it calculates a weight for each video, based on YouTube's computed category and views. A node graph is then created, using the weights as distance between nodes.
How we built it
Scrapy was used to gather data about YouTube videos, which is stored in a .json file. Then, we created a program to calculate weights for each video. These weights and the rest of the data are then presented in a node graph, which was created using the JavaScript graphical library D3.
Challenges we ran into
Due to the data set being extremely large, we came across the issue of computing times being too long. Also, we had little to no prior experience with most of the tools used to create our project.
Accomplishments that we're proud of
This weekend, we were capable of successfully collaborating to get a lot of work done in a short amount of time. In addition, we developed skills with and learned a lot about tools that were new to us.
What we learned
We learned how to use the JavaScript visual tool D3, gained experience with full-stack development, and learned how to adapt to failure and change in accordance to not waste time. We scrapped multiple ideas throughout the process of creating our project, but still came out with a successful product.
What's next for Visual Representation of YouTube Recommended Algorithm
In the future, we would like to expand this project to include more criteria, and test the criteria to find what is most correlated with the YouTube algorithm. Also, we plan to scale up our processing power, to increase the number of data points we can collect and process.
Built With
- d3.js
- javascript
- python
- scrapy


Log in or sign up for Devpost to join the conversation.