-
Vaccine Monitoring
-
Conspiracy Narratives


Inspiration
The World Health Organization has just launched the Africa Infodemic Response Alliance — a collaboration with multiple fact checking agencies across Africa responding to the anti-vax and Covid-19 disinformation across Africa.
Last month, I spoke with Hisham Mohamed, the head of the AIRA, who stressed the importance of combating disinformation in Africa, with an increasing number of anti-vax sentiment, and the continent posed as a unique proxy between Chinese, Russia, American, and European actors.
In this spirit, the purpose of our project is to limit the spread of harmful health disinformation in Africa through providing a coordinated platform for analyzing disinformation across African countries, and preventing disinformation, and a timely and strategic response.
What it does
Our project consists of two parts: data generation with sentiment analysis; and the geospatial visualization of the data on a map of Africa.
The data generation section of the project generates multiple datasets given a list of countries, companies, and time periods: company-specific data of headlines for each country, summary data of a company (including average public sentiment) for each country, and summary data of the most popular company in each country.
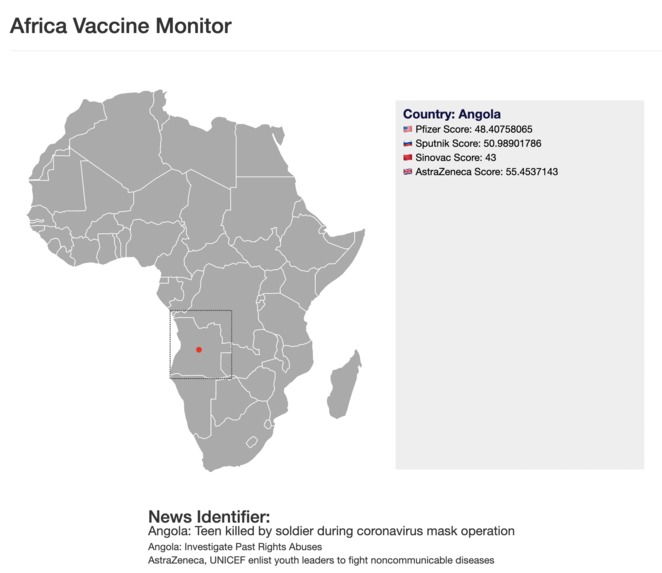
The data visualization on the “vaccine monitoring” page generates a map of Africa. When hovering over the country a flash card appears on the right with information on the country, and our analyzed sentiment score of the vaccine reception in the country for Pfizer, Sputnik V, Sinovac, and AstraZeneca.
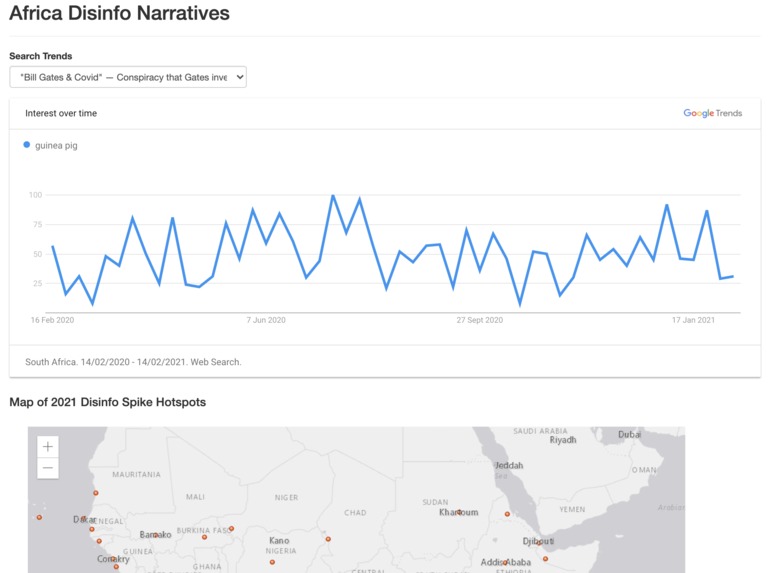
The data visualizations on the “conspiracy narratives” displays regions with spikes in a Covid-19 related conspiracy (such as Bill Gates invented Covid) based on the number of related google searches in the region, obtained from the google trends api.
How we built it
Data Generation: In this section of the project, we developed our data set. We started by scraping the popular news aggregator service, Google News. For each headline from this site, we were able to scrape the title, description of the article, date of publication, link to article, cover image, name of publisher. By narrowing our search, we were able to focus on headlines of specific countries and vaccine companies.
Using these headlines, we ran a sentiment analysis for the headlines of a country and took an average of these sentiments. The sentiment analysis was done using the pre-trained Valence Aware Dictionary and sEntiment Reasoner model. In this way, we generated a number between -1 and 1 to indicate the average sentiment of a country for a specific company's vaccine. Finally, in order to find the most popular company in each country, we decided to use the metric of aggregate total of positive articles per company to determine this.
Data Visualization: We built the vaccine map with D3.JS importing the data from analyzing news headlines and scraping news.google.com. We used the ArcGIS Javascript API and layers to display the map of conspiracy theory spikes, with imported data from the google trends api.
Challenges we ran into
One of the biggest challenges we ran into was developing the data set. At first, we thought there would be an easily accessible dataset of news headlines. However, we quickly realized this was not the case, and as a result, had to develop our own dataset. At this point, we turned our attention to the GoogleNewsAPI. Unfortunately, the API became deprecated 10 years ago. Therefore, we had to develop our own web scraper, data aggregation tools, and ultimately pull data directly from the Google News Site ourselves.
Another challenge we ran into was quantifying the data. Although we had a useful dataset of headlines, we needed some way to transform this textual data into meaningful and tangible numbers. To overcome this challenge, we zeroed in on several natural language processing tools and began analyzing the international sentiment of these companies. Incredibly, we were able to automate the analysis of human emotion towards a specific company across the continent.
Accomplishments that we're proud of
Some of the accomplishments we are most proud of are solutions we developed to overcome the challenges we faced. Generating the dataset is something we are very proud of because we had such a short time to create it, and so had to make the web scraping process both robust and lightweight. We are also very proud of our analysis of this data. Qualitative data is among the most difficult to both analyze and visualize in a way that everyday people can easily understand, and so we were especially proud of this aspect of our project.
Another accomplishment that we’re proud of was our use of ESRI. Although many of the members of our project had experience with GIS systems in general, we didn’t have too much experience with ArcGIS. Understanding how point layers and feature maps worked was a new experience for us and we are grateful that we had the opportunity to use them through TreeHacks.
What we learned
One of the biggest lessons we learned was the importance of mentors. For a long time, we were stuck on certain features of our project, such as the best way to visualize our data. After meeting with several company representatives and speaking to mentors, we were able to move past these difficult project roadblocks and focus on design elements. Another lesson we learned was the importance of timelines. We initially were interested in reaching more continents than just Africa. However, we recognized that we had a finite amount of time to pull this data. Therefore, we decided that it would be better to develop a comprehensive dataset of Africa rather than a sparse dataset of all the countries in the world. Finally, we learned a lot about geospatial data, web scraping, and data visualization. We learned about many new technologies, such as ESRI’s ArcGIS, certain sentiment analysis techniques, and the different way people quantify qualitative data.
What's next for Vaccine Sentiment Across the Globe
Adding in scraping articles from local news website; and adding in analysis of headlines in local languages, prioritizing arabic, french, and swahilli; scaling the project up to other continents, more advanced filtering and analysis of articles.


Log in or sign up for Devpost to join the conversation.