

vizGPT (vizgpt.ai) is an AI-powered data visualization tool that generates charts, dashboards, and even animated graphics from plain-language questions instead of chart-building menus or code. A user uploads a dataset, asks a question the way they'd ask a colleague, and vizGPT returns a chart along with the ability to keep refining it conversationally.
Analysts, marketers, and creators who need visuals fast make up much of vizGPT's user base, since the natural-language interface removes the usual requirement of knowing a charting library or a BI tool's menu structure. Beyond standard data charts, vizGPT has expanded into AI-generated Lottie and SVG animations and image generation, which broadens its appeal to people building presentations and creative assets rather than strictly business dashboards.
How vizGPT Works
Everything begins with a dataset — typically a CSV upload — which vizGPT parses through its Intelligent Data Table, a feature designed to profile and clean the data before any chart gets built. From there, the general AI chatbot interface takes natural-language requests, like asking for the distribution of a specific column or a comparison across categories, and returns a chart generated automatically from that intent. Because the AI keeps context across a session, follow-up requests can adjust the same visualization instead of starting over, so a user can iteratively narrow in on the right chart type and framing. Higher plans extend this same conversational approach into AI-generated Lottie animations, SVG graphics, and static images, plus an agent mode built for more involved data analysis tasks.
Key Features
- Natural-language chart generation: ask a question in plain English and get a chart built automatically from the underlying dataset
- General AI chatbot: a conversational interface for exploring data and requesting visualizations without menus or chart-type pickers
- Advanced data visualization: supports more complex chart types and visual analysis beyond basic bar and line charts
- Intelligent Data Table: profiles and transforms uploaded data automatically to prepare it for visualization
- AI Generative Lottie and SVG: produces animated Lottie graphics and scalable SVG animations from prompts, available from the Basic plan up
- AI image generation: creates standalone images from text prompts alongside data-driven charts
- Advanced models for higher-quality outputs: access to stronger underlying AI models on the Pro and Ultra plans for more refined results
- Agent mode for data analysis: a more autonomous mode for working through multi-step data analysis tasks, available on Pro and Ultra
vizGPT Pricing
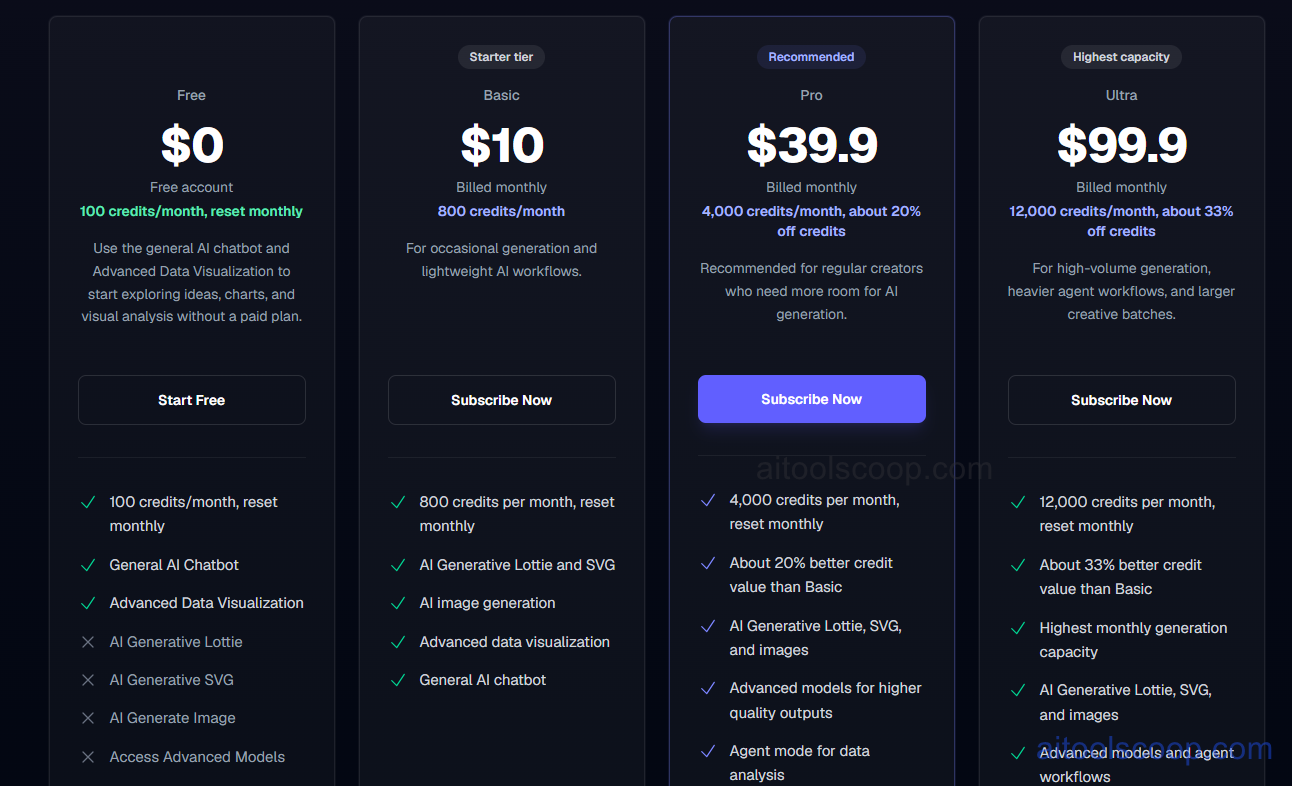
- Free — $0/month — 100 credits/month reset monthly: general AI chatbot and advanced data visualization, for exploring ideas without a paid plan.
- Basic — $10/month (from $60/year) — 800 credits/month: AI Generative Lottie and SVG, AI image generation, advanced data visualization, and the general AI chatbot, for occasional generation and lightweight AI workflows.
- Pro — $39.9/month (from $239/year) — 4,000 credits/month with about 20% better credit value than Basic: everything in Basic plus advanced models for higher-quality outputs and agent mode for data analysis, recommended for regular creators who need more room for AI generation.
- Ultra — $99.9/month (from $599/year) — 12,000 credits/month with about 33% better credit value than Basic: the highest monthly generation capacity, everything in Pro, for high-volume generation, heavier agent workflows, and larger creative batches.
All paid plans reset credits monthly, with annual billing lowering the effective monthly rate on every tier by roughly half compared to paying monthly. Pricing verified from vizgpt.ai; rates may change — always confirm current pricing at vizgpt.ai.
Who Should Use vizGPT?
Anyone who needs a chart or dashboard quickly and would rather describe what they want than configure it manually is a strong fit for vizGPT, especially non-technical users who don't already know a BI tool's chart-building workflow. The Free plan's 100 monthly credits suit occasional exploration, while Basic covers lightweight, regular use for individuals producing a handful of visuals or animations a month. Pro is the plan most regular creators land on, since its 20% better credit value and agent mode support ongoing work rather than occasional generation. Ultra exists for teams or individuals running high-volume generation — large creative batches, heavier agent workflows — where 12,000 monthly credits and the best per-credit value justify the higher price. Teams needing enterprise governance, dedicated support, or custom deployment aren't the current focus of vizGPT's published tiers and should check directly with the vizGPT team about available options.
Frequently Asked Questions
What is vizGPT used for?
vizGPT turns natural-language questions into data visualizations, letting users upload a dataset and ask for a chart the way they'd ask a colleague, rather than configuring chart types and fields manually. Higher plans extend the same conversational approach to AI-generated animations and images.
Is there a free version of vizGPT?
Yes. The Free plan includes 100 credits per month, reset monthly, covering the general AI chatbot and advanced data visualization features, with no paid plan required to start.
How does vizGPT's credit system work?
Each plan includes a set number of credits that reset monthly — 100 on Free, 800 on Basic, 4,000 on Pro, and 12,000 on Ultra. Higher tiers also carry better credit value, with Pro offering about 20% more value per credit than Basic and Ultra about 33% more.
Can vizGPT create animations, not just charts?
Yes. From the Basic plan up, vizGPT can generate Lottie animations and scalable SVG graphics from prompts, alongside standard AI image generation and its core data visualization features.
Does vizGPT offer annual billing?
Yes. Each paid plan has an annual option that lowers the effective monthly cost by roughly half compared to paying month to month — for example, Basic drops from $10/month to an annual total of $60/year.


